The SFS Beta
NOAA's next seasonal system, published as a beta while it is being built and freely readable by anyone. It runs twelve months where the rest of this site runs six or seven, and it carries a 1991–2025 reforecast — the most recent baseline here by nine years. That combination lets this page do something no other route can: put a measured skill number against every one of the twelve leads, and so show where a seasonal forecast stops being a forecast instead of settling the question by truncating the axis.
Two experiments run side by side — beta1 and, since September 2026, beta2, a different model on the same design. The plate switches between them, they are scored against each other below it, and every section after that describes beta2.
Leads
Reforecast
Useful to
Niño-3.4 peak
The plate
10 layers · 7 views · 12 months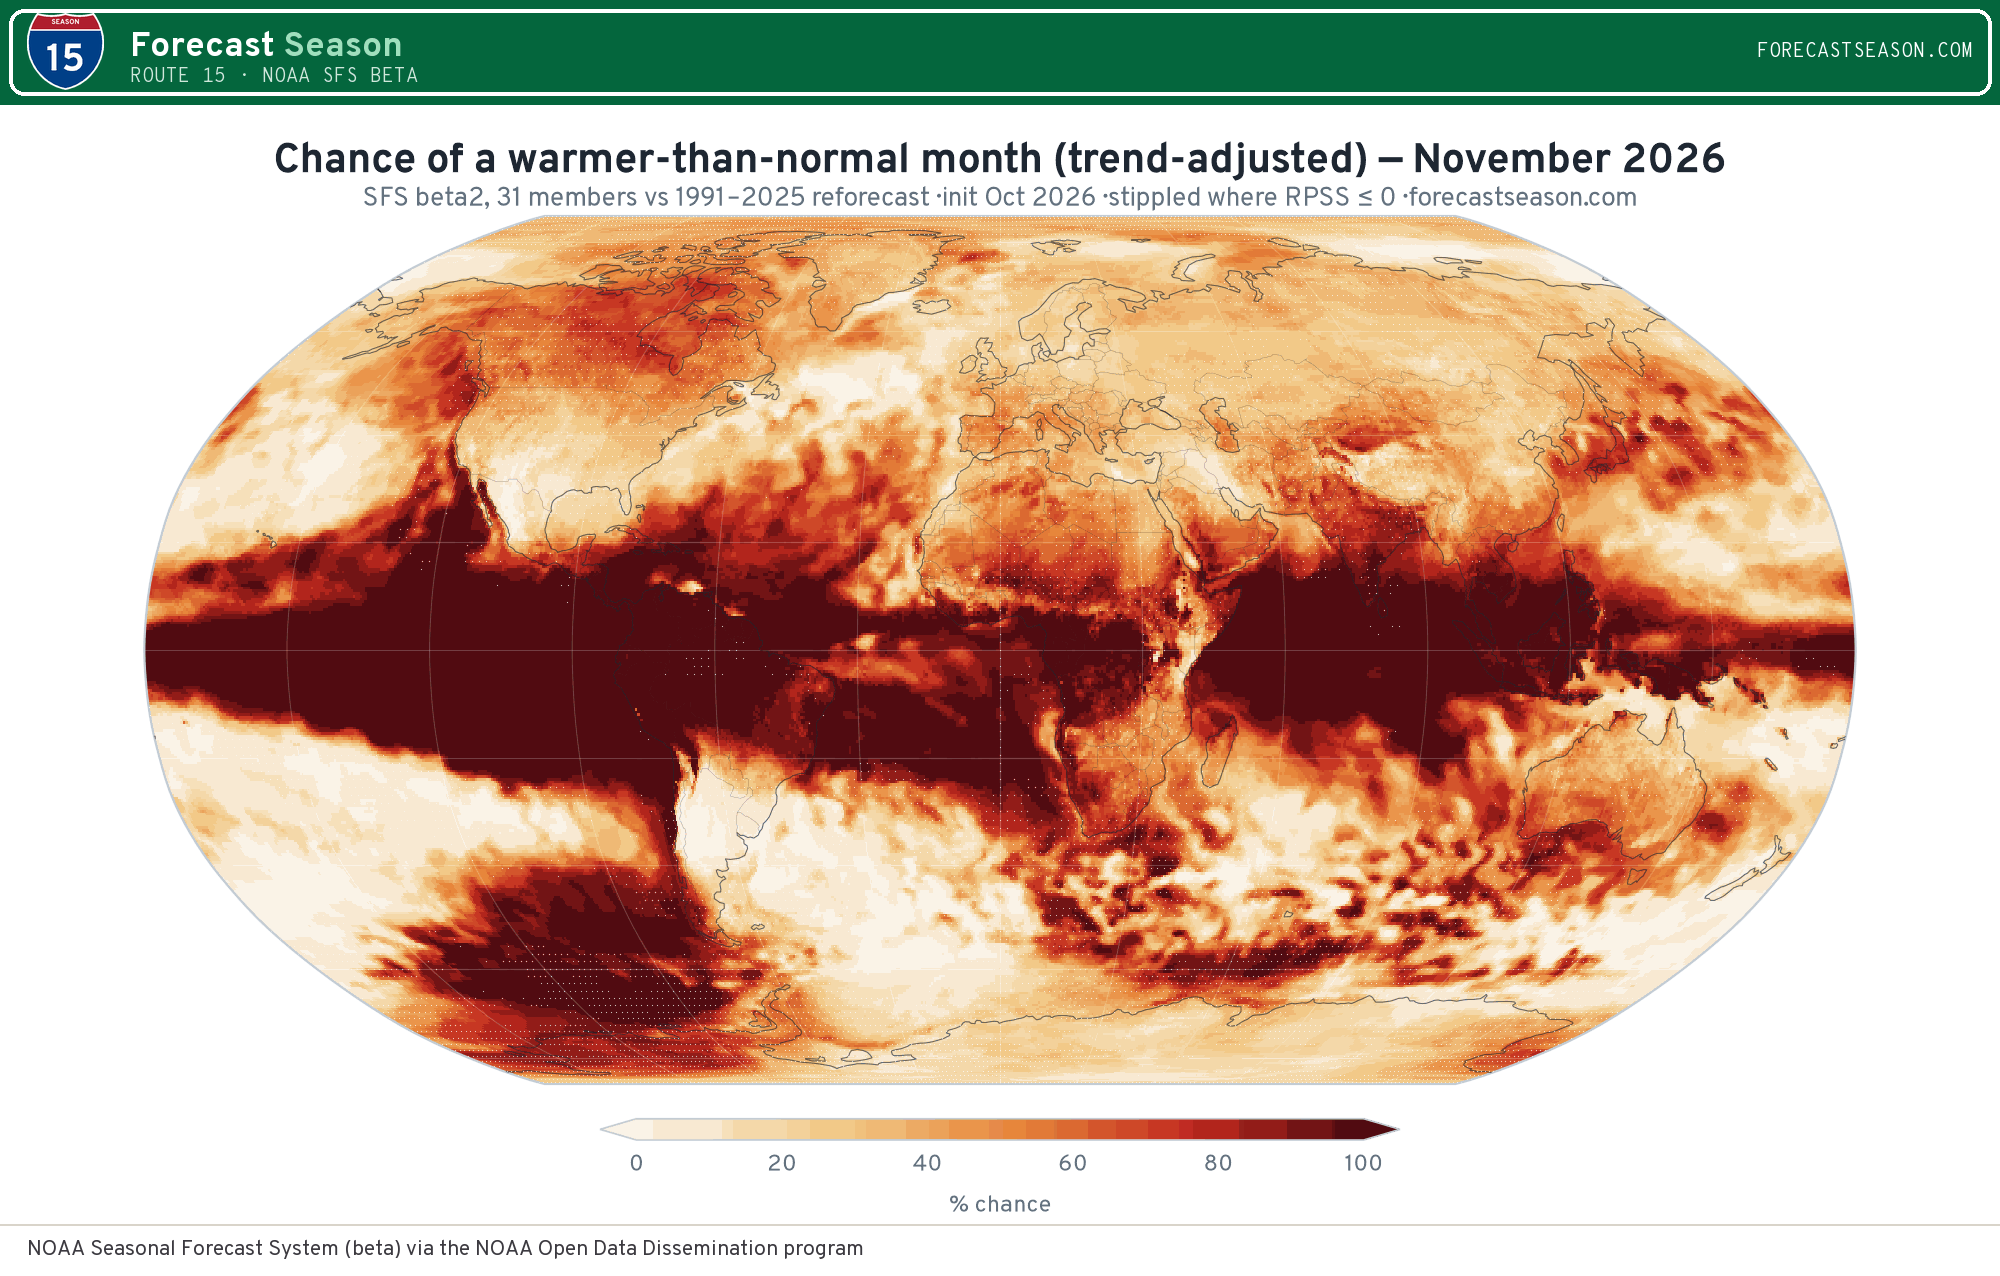
The probability that this month lands in the warmest third, with the 1991–2025 tercile boundaries moved to today's climate by the reforecast's own warming. Climatology is 33 %. This is the panel to read.
* Lead 1 is the initialisation's own month, so part of it has already happened. It is kept because the model produced it, not because it is a forecast for days that are over.
Every temperature and rainfall panel except the two skill layers is stippled where the RPSS is zero or below — where issuing these probabilities would be no better than saying nothing. At the longest leads that is most of the map, which is the honest picture of a twelve-month forecast rather than a fault in it.
The two snow layers are not stippled and have no skill layer under them, because ERA5 as held here carries no snowfall to score them against. They are this model measured against its own reforecast, and they are blank wherever that reforecast has essentially no snow to have a tercile about.
Two betas, one start
beta1 vs beta2 · same reforecast years · same ERA5This month the two experiments are on different starts — beta1 on 1 September 2026, beta2 on 1 October 2026 — because NOAA has published no October start for beta1 and beta1 has no October reforecast to calibrate one against. Scoring different starts against each other would compare the starts rather than the models, so no head-to-head is drawn.
How far out is it worth reading?
beta2 · 35 reforecast years vs ERA5This is the only page on the site that can answer the question directly, because it is the only system here that both runs twelve months and has 35 years of reforecast to score them against. Every other route stops at six or seven, which settles the question by declining to ask it.
The answer for this start is not the one the question expects. Over land the temperature terciles never fail to beat a coin-toss climatology — the RPSS is positive at every one of the twelve leads. It falls from +0.049 at lead 2 to a minimum of +0.006 at January 2027 (lead 4), and is +0.052 at lead 12. Rainfall clears zero at 0 of the 11 whole leads, which is the ordinary seasonal-rainfall result and not a property of this model.
So the useful reading is the shape, and the shape is not a simple decay. Over land the first three whole leads average +0.024 and the last three average +0.051, but the worst month is neither: it is January 2027, in the middle of the range, and the score recovers after it. Whatever governs that is not lead alone. With 35 cases per point the wobble is well inside the noise, so this page does not offer a mechanism for it — only the observation that a monotonic decay is not what the reforecast shows, and that reading the twelfth lead as necessarily worse than the sixth would be wrong here.
Where the remaining skill lives also moves. At the near leads the global score (+0.111) runs well above the land score (+0.024), which is the tropical ocean carrying it; by the far leads the two have converged (+0.013 against +0.051), and land is the higher of the two. Either way a small positive number averaged over a hemisphere is not a forecast for any particular place in it — read the map, where the same score is drawn gridpoint by gridpoint and most of the land is stippled.
Temperature
| Target month | Lead | RPSS land | RPSS global | ACC land | Land beating climatology |
|---|---|---|---|---|---|
| October 2026* | 1 | +0.185 | +0.271 | +0.612 | 85% |
| November 2026 | 2 | +0.049 | +0.136 | +0.377 | 58% |
| December 2026 | 3 | +0.018 | +0.106 | +0.328 | 51% |
| January 2027 | 4 | +0.006 | +0.092 | +0.302 | 43% |
| February 2027 | 5 | +0.033 | +0.078 | +0.319 | 51% |
| March 2027 | 6 | +0.053 | +0.063 | +0.377 | 58% |
| April 2027 | 7 | +0.068 | +0.064 | +0.384 | 66% |
| May 2027 | 8 | +0.020 | +0.050 | +0.313 | 47% |
| June 2027 | 9 | +0.041 | +0.033 | +0.334 | 55% |
| July 2027 | 10 | +0.068 | +0.032 | +0.383 | 63% |
| August 2027 | 11† | +0.035 | +0.004 | +0.358 | 55% |
| September 2027 | 12† | +0.052 | +0.004 | +0.379 | 59% |
Rainfall
| Target month | Lead | RPSS land | RPSS global | ACC land | Land beating climatology |
|---|---|---|---|---|---|
| October 2026* | 1 | +0.016 | +0.007 | +0.344 | 43% |
| November 2026 | 2 | -0.045 | -0.036 | +0.153 | 27% |
| December 2026 | 3 | -0.052 | -0.032 | +0.133 | 23% |
| January 2027 | 4 | -0.068 | -0.048 | +0.094 | 19% |
| February 2027 | 5 | -0.070 | -0.060 | +0.082 | 18% |
| March 2027 | 6 | -0.080 | -0.075 | +0.059 | 15% |
| April 2027 | 7 | -0.089 | -0.080 | +0.021 | 13% |
| May 2027 | 8 | -0.079 | -0.077 | +0.036 | 15% |
| June 2027 | 9 | -0.082 | -0.082 | +0.043 | 14% |
| July 2027 | 10 | -0.085 | -0.083 | +0.031 | 12% |
| August 2027 | 11† | -0.093 | -0.090 | +0.017 | 11% |
| September 2027 | 12† | -0.095 | -0.091 | +0.010 | 13% |
† Scored over 34 of the 35 reforecast years, not all of them: the newest reforecast year's target month at that lead has not happened long enough ago to be in ERA5. The year is left out of the score rather than scored against nothing.
RPSS grades the probabilities the plate actually publishes, against a 1-in-3 climatological forecast; ACC grades the ensemble mean's anomaly instead, and is shown beside it because the two disagree in an informative way at long leads — a model can keep the sign of an anomaly after it has stopped being able to place it in a tercile. Both are leave-one-out: the boundaries and the climatology for each year are built from the other 34. Land-only columns exclude the ocean, where most of the apparent long-lead skill lives and where almost nobody needs a forecast.
Read as a season, not a month
beta2 · whole three-month means · 35 reforecast yearsA seasonal outlook is usually read as a season — December-February, not January — and three months averaged together is a quieter quantity than any one of them. That is measurable here rather than assumed: over land the March–May 2027 temperature terciles score +0.132, against +0.068 for the best of the three months inside it on its own. The season beats its own best month in all 3 whole seasons this start covers — the gain is the averaging, not the model seeing further. Rainfall clears zero over land in 0 of the 3 whole seasons, so the seasonal rainfall terciles are worth about what the monthly ones are: not much.
Temperature
| Season | Months | RPSS land | Best month inside it | RPSS global | ACC land | Land beating climatology |
|---|---|---|---|---|---|---|
| December–February 2026–2027 | Dec, Jan, Feb | +0.081 | +0.033 | +0.153 | +0.435 | 61% |
| March–May 2027 | Mar, Apr, May | +0.132 | +0.068 | +0.118 | +0.493 | 76% |
| June–August 2027 | Jun, Jul, Aug | +0.116 | +0.068 | +0.060 | +0.471 | 69% |
Rainfall
| Season | Months | RPSS land | Best month inside it | RPSS global | ACC land | Land beating climatology |
|---|---|---|---|---|---|---|
| December–February 2026–2027 | Dec, Jan, Feb | -0.042 | -0.052 | -0.012 | +0.183 | 27% |
| March–May 2027 | Mar, Apr, May | -0.076 | -0.079 | -0.070 | +0.071 | 20% |
| June–August 2027 | Jun, Jul, Aug | -0.082 | -0.082 | -0.088 | +0.063 | 16% |
A season is built the same way the months are and scored by the same leave-one-out: each member's three monthly fields are averaged first, the tercile boundaries come from the reforecast's own seasonal means, and ERA5 is averaged over the same three months in every year that has all three of them. Rainfall is averaged as millimetres per month, so a season that straddles a long month and a short one is not weighted by whichever one the code met first. Only whole seasons are offered — all three months must fall inside the twelve leads — which is why this start has four and another may have three. A season marked * contains the initialisation's own month and is therefore partly already observed.
Snow, unverified
beta2 · the model against its own climate · no skill scoreThese two panels carry no skill score. The ERA5 archive behind this site holds temperature, rainfall, sea-surface temperature and pressure — no snowfall — so there is nothing here to verify a snow forecast against, and no RPSS, no ACC and no stippling appear on them. What they show is this model against its own 1991–2025 reforecast: real information about what SFS is doing, with the usual question of whether it is any good left open. On that basis the strongest land signal is December–February 2026–2027, where the chance of the snowier third is 40% against a climatological 33%, with 47% of the globe blank because the reforecast has essentially no snow there to have a tercile about.
By season
| Season | Chance of the snowiest third, land | Median snow anomaly, land (mm/month) | Globe blank |
|---|---|---|---|
| December–February 2026–2027 | 40% | +0.9 | 47% |
| March–May 2027 | 36% | +0.6 | 47% |
| June–August 2027 | 30% | -0.3 | 59% |
By month
| Target month | Chance of the snowiest third, land | Median snow anomaly, land (mm/month) | Globe blank |
|---|---|---|---|
| October 2026* | 28% | -2.5 | 52% |
| November 2026 | 34% | -0.4 | 50% |
| December 2026 | 35% | -0.1 | 49% |
| January 2027 | 38% | +1.6 | 49% |
| February 2027 | 38% | +1.4 | 49% |
| March 2027 | 37% | +1.3 | 49% |
| April 2027 | 34% | +0.6 | 50% |
| May 2027 | 33% | -0.0 | 53% |
| June 2027 | 32% | -0.3 | 61% |
| July 2027 | 30% | -0.4 | 65% |
| August 2027 | 31% | +0.1 | 63% |
| September 2027 | 31% | +0.3 | 56% |
Snowfall is published here as millimetres of water for the month, which is what the model carries — not depth on the ground, which depends on how the snow packs and is not in this archive. The field is the model's own tsnowpsfc, present in both the live run and the 35-year reforecast, so the terciles and the trend adjustment are built exactly as they are for temperature and rainfall. The one thing missing is the observation: until an ERA5 snowfall record is ingested here, nothing on this page can say whether these probabilities are any better than a coin. The blank column is the share of the globe where the reforecast median is under a millimetre for the period — most of the planet in most months, and every panel is blank there rather than painting a confident number over a tercile that does not exist.
What the trend adjustment does
beta2 · and what it does notScored against its reforecast boundaries exactly as they stand, SFS puts 71% on "warmer than normal" averaged over the whole globe and every whole lead. That is true and almost information-free: most of it is the warming between the middle of the reforecast and now, not next season. Moved to today's climate by the reforecast's own pointwise trend it reads 52% — which varies by lead and by region and can be read as a forecast.
What makes this worth restating on a fourth route is that SFS's reforecast runs to 2025, not to 2016 like SEAS5's and the NMME's. A baseline nine years more recent should have shrunk the problem, and it barely does: the raw number here is within a couple of points of the one route 10 reports from a 1993–2016 window. The tercile-baseline problem is not an artefact of an old hindcast. It is what happens whenever a fixed baseline is asked to describe a moving climate.
The adjustment moves temperature by 14–28 points and rainfall by 0.1–0.7. That asymmetry is why temperature carries two tercile panels on the plate and rainfall carries one: a second rainfall panel would look like a product and contain nothing. The assumption underneath it is the reforecast's own warming over land, +0.38 to +0.44 °C per decade, which shifts the boundaries by roughly +0.7 to +0.8 °C across the 18 years since the middle of 1991–2025.
Temperature
| Target month | Raw land | Adjusted land | Shift (pts) | Reforecast trend (°C/decade, land) |
|---|---|---|---|---|
| October 2026* | 74.6% 73.9% | 57.3% 56.8% | -17.2 | +0.40 |
| November 2026 | 71.2% 68.6% | 55.7% 54.1% | -15.4 | +0.40 |
| December 2026 | 70.5% 69.7% | 54.6% 55.8% | -15.9 | +0.41 |
| January 2027 | 69.6% 68.9% | 55.1% 56.0% | -14.5 | +0.44 |
| February 2027 | 69.7% 70.7% | 56.3% 59.9% | -13.5 | +0.40 |
| March 2027 | 69.4% 70.1% | 54.5% 57.2% | -14.9 | +0.40 |
| April 2027 | 68.9% 65.4% | 52.2% 51.2% | -16.6 | +0.38 |
| May 2027 | 70.4% 67.4% | 51.8% 51.3% | -18.6 | +0.38 |
| June 2027 | 71.3% 69.5% | 49.9% 49.1% | -21.4 | +0.38 |
| July 2027 | 73.3% 74.2% | 49.1% 49.4% | -24.2 | +0.40 |
| August 2027 | 73.9% 71.6% | 47.1% 44.1% | -26.8 | +0.40 |
| September 2027 | 73.8% 69.9% | 45.7% 42.9% | -28.1 | +0.40 |
Rainfall
| Target month | Raw land | Adjusted land | Shift (pts) | Land blanked as arid |
|---|---|---|---|---|
| October 2026* | 34.6% 33.3% | 35.9% 35.2% | +1.4 | 10.1% |
| November 2026 | 36.4% 39.8% | 36.9% 39.0% | +0.5 | 11.0% |
| December 2026 | 35.1% 37.0% | 35.0% 35.8% | -0.2 | 11.2% |
| January 2027 | 35.9% 36.7% | 36.3% 35.7% | +0.4 | 11.6% |
| February 2027 | 35.6% 37.2% | 36.1% 36.5% | +0.6 | 10.3% |
| March 2027 | 35.4% 37.4% | 36.1% 37.0% | +0.7 | 7.7% |
| April 2027 | 36.1% 37.3% | 36.7% 36.4% | +0.5 | 7.4% |
| May 2027 | 36.4% 36.8% | 36.5% 36.5% | +0.1 | 8.2% |
| June 2027 | 36.3% 35.6% | 36.8% 36.0% | +0.5 | 9.3% |
| July 2027 | 35.9% 37.3% | 36.1% 37.5% | +0.3 | 9.9% |
| August 2027 | 35.8% 36.2% | 36.2% 36.9% | +0.4 | 9.9% |
| September 2027 | 34.3% 33.9% | 34.5% 34.4% | +0.3 | 9.4% |
Rainfall's last column is the share of the globe blanked as too arid for a tercile to be a category: where the hindcast median is under 5 mm for the month, the entire span between "below normal" and "above normal" is about a millimetre. Left in, a model that correctly predicts near-zero rain every year would score real skill at forecasting desert rainfall — it is doing the opposite. Every rainfall panel and every rainfall number on this page is blanked there.
ENSO and the Indian Ocean
beta1 and beta2 · six indices · twelve leads, each scoredNiño 3.4 5°N–5°S, 170°W–120°W
Table: every value in these two charts
| Target month | Lead | beta1 mean 10–90 % | beta2 mean 10–90 % | ACC beta1 93–16 | ACC beta2 93–16 | Persistence | Spread ÷ RMSE b1 / b2 |
|---|---|---|---|---|---|---|---|
| October 2026* | 1 | — | +3.50 +3.4 to +3.6 | — | +0.99 +0.99 | +0.97 | — / 0.49 |
| November 2026 | 2 | — | +3.47 +3.3 to +3.7 | — | +0.99 +0.99 | +0.96 | — / 0.88 |
| December 2026 | 3 | — | +3.32 +3.2 to +3.5 | — | +0.97 +0.98 | +0.94 | — / 0.72 |
| January 2027 | 4 | — | +2.91 +2.7 to +3.1 | — | +0.95 +0.96 | +0.92 | — / 0.71 |
| February 2027 | 5 | — | +2.23 +1.8 to +2.4 | — | +0.91 +0.92 | +0.89 | — / 0.67 |
| March 2027 | 6 | — | +1.54 +1.0 to +2.0 | — | +0.82 +0.85 | +0.84 | — / 0.72 |
| April 2027 | 7 | — | +1.22 +0.9 to +1.6 | — | +0.71 +0.81 | +0.70 | — / 0.79 |
| May 2027 | 8 | — | +1.12 +0.7 to +1.6 | — | +0.44 +0.56 | +0.35 | — / 0.74 |
| June 2027 | 9 | — | +0.50 -0.3 to +1.0 | — | +0.51 +0.54 | -0.06 | — / 0.81 |
| July 2027 | 10 | — | +0.53 -0.3 to +1.1 | — | +0.54 +0.51 | -0.23 | — / 0.90 |
| August 2027 | 11 | — | +0.89 +0.3 to +1.5 | — | +0.56 +0.51 | -0.20 | — / 0.91 |
| September 2027 | 12 | — | +1.08 +0.2 to +1.7 | — | +0.52 +0.45 | -0.17 | — / 0.86 |
| Observed month | ERA5 anomaly (°C) |
|---|---|
| October 2025 | -0.58 |
| November 2025 | -0.73 |
| December 2025 | -0.62 |
| January 2026 | -0.44 |
| February 2026 | -0.16 |
| March 2026 | +0.09 |
| April 2026 | +0.52 |
| May 2026 | +1.06 |
| June 2026 | +1.53 |
| July 2026 | +2.10 |
| August 2026 | +2.66 |
| September 2026 | +2.98 |
Relative Niño 3.4 Niño 3.4 minus the 20°N–20°S mean (not rescaled)
Table: every value in these two charts
| Target month | Lead | beta1 mean 10–90 % | beta2 mean 10–90 % | ACC beta1 93–16 | ACC beta2 93–16 | Persistence | Spread ÷ RMSE b1 / b2 |
|---|---|---|---|---|---|---|---|
| October 2026* | 1 | — | +2.32 +2.2 to +2.4 | — | +0.99 +0.99 | +0.97 | — / 0.51 |
| November 2026 | 2 | — | +2.16 +2.0 to +2.4 | — | +0.98 +0.98 | +0.96 | — / 0.82 |
| December 2026 | 3 | — | +1.97 +1.8 to +2.1 | — | +0.97 +0.97 | +0.94 | — / 0.67 |
| January 2027 | 4 | — | +1.55 +1.4 to +1.7 | — | +0.94 +0.95 | +0.90 | — / 0.66 |
| February 2027 | 5 | — | +0.95 +0.5 to +1.2 | — | +0.90 +0.90 | +0.85 | — / 0.60 |
| March 2027 | 6 | — | +0.36 -0.1 to +0.7 | — | +0.81 +0.81 | +0.79 | — / 0.66 |
| April 2027 | 7 | — | +0.11 -0.2 to +0.4 | — | +0.71 +0.67 | +0.65 | — / 0.73 |
| May 2027 | 8 | — | +0.04 -0.3 to +0.4 | — | +0.38 +0.31 | +0.24 | — / 0.68 |
| June 2027 | 9 | — | -0.50 -1.0 to +0.0 | — | +0.54 +0.57 | -0.16 | — / 0.77 |
| July 2027 | 10 | — | -0.40 -0.9 to +0.0 | — | +0.59 +0.59 | -0.29 | — / 0.85 |
| August 2027 | 11 | — | +0.01 -0.5 to +0.5 | — | +0.59 +0.55 | -0.21 | — / 0.86 |
| September 2027 | 12 | — | +0.22 -0.3 to +0.8 | — | +0.54 +0.48 | -0.17 | — / 0.85 |
| Observed month | ERA5 anomaly (°C) |
|---|---|
| October 2025 | -0.74 |
| November 2025 | -0.81 |
| December 2025 | -0.74 |
| January 2026 | -0.63 |
| February 2026 | -0.44 |
| March 2026 | -0.21 |
| April 2026 | +0.07 |
| May 2026 | +0.55 |
| June 2026 | +0.90 |
| July 2026 | +1.42 |
| August 2026 | +1.88 |
| September 2026 | +2.09 |
Niño 3 5°N–5°S, 150°W–90°W
Table: every value in these two charts
| Target month | Lead | beta1 mean 10–90 % | beta2 mean 10–90 % | ACC beta1 93–16 | ACC beta2 93–16 | Persistence | Spread ÷ RMSE b1 / b2 |
|---|---|---|---|---|---|---|---|
| October 2026* | 1 | — | +4.44 +4.4 to +4.5 | — | +0.99 +0.99 | +0.98 | — / 0.66 |
| November 2026 | 2 | — | +4.49 +4.3 to +4.6 | — | +0.99 +0.99 | +0.96 | — / 0.92 |
| December 2026 | 3 | — | +4.16 +4.0 to +4.3 | — | +0.97 +0.98 | +0.93 | — / 0.80 |
| January 2027 | 4 | — | +3.58 +3.4 to +3.8 | — | +0.94 +0.96 | +0.92 | — / 0.82 |
| February 2027 | 5 | — | +2.75 +2.5 to +2.9 | — | +0.86 +0.86 | +0.87 | — / 0.81 |
| March 2027 | 6 | — | +2.17 +1.8 to +2.4 | — | +0.74 +0.75 | +0.75 | — / 0.83 |
| April 2027 | 7 | — | +1.99 +1.7 to +2.3 | — | +0.68 +0.77 | +0.54 | — / 0.97 |
| May 2027 | 8 | — | +2.13 +1.3 to +2.6 | — | +0.52 +0.60 | +0.13 | — / 0.91 |
| June 2027 | 9 | — | +1.41 +0.3 to +2.1 | — | +0.54 +0.53 | -0.17 | — / 0.89 |
| July 2027 | 10 | — | +1.10 +0.3 to +1.8 | — | +0.58 +0.48 | -0.25 | — / 0.90 |
| August 2027 | 11 | — | +1.18 +0.4 to +1.7 | — | +0.60 +0.48 | -0.23 | — / 0.86 |
| September 2027 | 12 | — | +1.25 +0.6 to +1.8 | — | +0.56 +0.45 | -0.16 | — / 0.73 |
| Observed month | ERA5 anomaly (°C) |
|---|---|
| October 2025 | -0.51 |
| November 2025 | -0.64 |
| December 2025 | -0.75 |
| January 2026 | -0.46 |
| February 2026 | +0.04 |
| March 2026 | +0.28 |
| April 2026 | +0.55 |
| May 2026 | +1.29 |
| June 2026 | +1.80 |
| July 2026 | +2.48 |
| August 2026 | +3.32 |
| September 2026 | +3.83 |
Niño 4 5°N–5°S, 160°E–150°W
Table: every value in these two charts
| Target month | Lead | beta1 mean 10–90 % | beta2 mean 10–90 % | ACC beta1 93–16 | ACC beta2 93–16 | Persistence | Spread ÷ RMSE b1 / b2 |
|---|---|---|---|---|---|---|---|
| October 2026* | 1 | — | +1.48 +1.4 to +1.6 | — | +0.98 +0.98 | +0.97 | — / 0.44 |
| November 2026 | 2 | — | +1.48 +1.3 to +1.7 | — | +0.98 +0.98 | +0.96 | — / 0.67 |
| December 2026 | 3 | — | +1.51 +1.3 to +1.7 | — | +0.96 +0.96 | +0.94 | — / 0.63 |
| January 2027 | 4 | — | +1.28 +1.0 to +1.5 | — | +0.93 +0.94 | +0.89 | — / 0.54 |
| February 2027 | 5 | — | +0.97 +0.7 to +1.3 | — | +0.90 +0.91 | +0.86 | — / 0.48 |
| March 2027 | 6 | — | +0.58 +0.2 to +0.9 | — | +0.75 +0.82 | +0.81 | — / 0.48 |
| April 2027 | 7 | — | +0.30 -0.1 to +0.7 | — | +0.56 +0.67 | +0.69 | — / 0.54 |
| May 2027 | 8 | — | +0.29 -0.1 to +0.8 | — | +0.44 +0.56 | +0.54 | — / 0.54 |
| June 2027 | 9 | — | +0.30 -0.0 to +0.6 | — | +0.46 +0.49 | +0.42 | — / 0.59 |
| July 2027 | 10 | — | +0.42 -0.0 to +0.9 | — | +0.35 +0.44 | +0.28 | — / 0.63 |
| August 2027 | 11 | — | +0.55 -0.0 to +0.9 | — | +0.37 +0.39 | +0.10 | — / 0.76 |
| September 2027 | 12 | — | +0.72 -0.1 to +1.3 | — | +0.35 +0.41 | +0.02 | — / 0.88 |
| Observed month | ERA5 anomaly (°C) |
|---|---|
| October 2025 | -0.37 |
| November 2025 | -0.57 |
| December 2025 | -0.27 |
| January 2026 | +0.05 |
| February 2026 | +0.28 |
| March 2026 | +0.40 |
| April 2026 | +0.84 |
| May 2026 | +1.09 |
| June 2026 | +1.21 |
| July 2026 | +1.02 |
| August 2026 | +1.02 |
| September 2026 | +1.03 |
Niño 1+2 0–10°S, 90°W–80°W
Table: every value in these two charts
| Target month | Lead | beta1 mean 10–90 % | beta2 mean 10–90 % | ACC beta1 93–16 | ACC beta2 93–16 | Persistence | Spread ÷ RMSE b1 / b2 |
|---|---|---|---|---|---|---|---|
| October 2026* | 1 | — | +5.16 +5.0 to +5.3 | — | +0.97 +0.97 | +0.96 | — / 0.52 |
| November 2026 | 2 | — | +4.63 +4.3 to +4.9 | — | +0.95 +0.95 | +0.89 | — / 0.72 |
| December 2026 | 3 | — | +4.11 +3.8 to +4.4 | — | +0.91 +0.92 | +0.83 | — / 0.77 |
| January 2027 | 4 | — | +3.24 +3.0 to +3.6 | — | +0.79 +0.78 | +0.79 | — / 0.85 |
| February 2027 | 5 | — | +2.32 +1.9 to +2.7 | — | +0.55 +0.43 | +0.57 | — / 0.63 |
| March 2027 | 6 | — | +2.07 +1.8 to +2.3 | — | +0.25 +0.17 | +0.28 | — / 0.44 |
| April 2027 | 7 | — | +2.54 +2.1 to +2.9 | — | +0.47 +0.49 | +0.17 | — / 0.57 |
| May 2027 | 8 | — | +3.41 +2.9 to +4.0 | — | +0.65 +0.76 | +0.11 | — / 0.84 |
| June 2027 | 9 | — | +3.09 +1.6 to +4.1 | — | +0.57 +0.59 | -0.04 | — / 0.76 |
| July 2027 | 10 | — | +1.78 +0.4 to +2.9 | — | +0.51 +0.37 | -0.10 | — / 0.61 |
| August 2027 | 11 | — | +1.07 +0.2 to +1.7 | — | +0.55 +0.36 | -0.15 | — / 0.60 |
| September 2027 | 12 | — | +0.95 +0.3 to +1.5 | — | +0.54 +0.38 | -0.17 | — / 0.53 |
| Observed month | ERA5 anomaly (°C) |
|---|---|
| October 2025 | -0.14 |
| November 2025 | -0.43 |
| December 2025 | -0.53 |
| January 2026 | -0.06 |
| February 2026 | +0.95 |
| March 2026 | +1.22 |
| April 2026 | +1.53 |
| May 2026 | +2.01 |
| June 2026 | +3.02 |
| July 2026 | +3.70 |
| August 2026 | +4.22 |
| September 2026 | +5.09 |
Indian Ocean Dipole DMI: 10°N–10°S 50–70°E minus 0–10°S 90–110°E
Table: every value in these two charts
| Target month | Lead | beta1 mean 10–90 % | beta2 mean 10–90 % | ACC beta1 93–16 | ACC beta2 93–16 | Persistence | Spread ÷ RMSE b1 / b2 |
|---|---|---|---|---|---|---|---|
| October 2026* | 1 | — | +0.35 +0.2 to +0.6 | — | +0.95 +0.93 | +0.92 | — / 0.52 |
| November 2026 | 2 | — | +0.36 +0.0 to +0.6 | — | +0.84 +0.75 | +0.81 | — / 0.64 |
| December 2026 | 3 | — | +0.20 -0.2 to +0.5 | — | +0.51 +0.37 | +0.68 | — / 0.82 |
| January 2027 | 4 | — | +0.10 -0.3 to +0.4 | — | +0.15 +0.12 | +0.35 | — / 1.03 |
| February 2027 | 5 | — | -0.13 -0.5 to +0.3 | — | +0.23 +0.02 | -0.07 | — / 0.95 |
| March 2027 | 6 | — | -0.14 -0.5 to +0.3 | — | +0.29 +0.03 | -0.10 | — / 0.89 |
| April 2027 | 7 | — | +0.04 -0.3 to +0.4 | — | +0.10 -0.04 | -0.35 | — / 1.11 |
| May 2027 | 8 | — | +0.25 -0.2 to +0.6 | — | +0.15 +0.05 | +0.05 | — / 1.04 |
| June 2027 | 9 | — | +0.31 -0.1 to +0.8 | — | +0.03 -0.19 | +0.01 | — / 1.00 |
| July 2027 | 10 | — | +0.27 -0.2 to +0.7 | — | -0.00 +0.00 | -0.24 | — / 0.87 |
| August 2027 | 11 | — | +0.17 -0.4 to +0.7 | — | -0.10 -0.00 | -0.17 | — / 0.75 |
| September 2027 | 12 | — | -0.06 -0.6 to +0.6 | — | +0.04 +0.11 | -0.27 | — / 0.73 |
| Observed month | ERA5 anomaly (°C) |
|---|---|
| October 2025 | -1.46 |
| November 2025 | -0.79 |
| December 2025 | -0.20 |
| January 2026 | +0.16 |
| February 2026 | +0.49 |
| March 2026 | +0.19 |
| April 2026 | +0.01 |
| May 2026 | -0.34 |
| June 2026 | -0.22 |
| July 2026 | +0.28 |
| August 2026 | +0.30 |
| September 2026 | +0.70 |
Below the surface
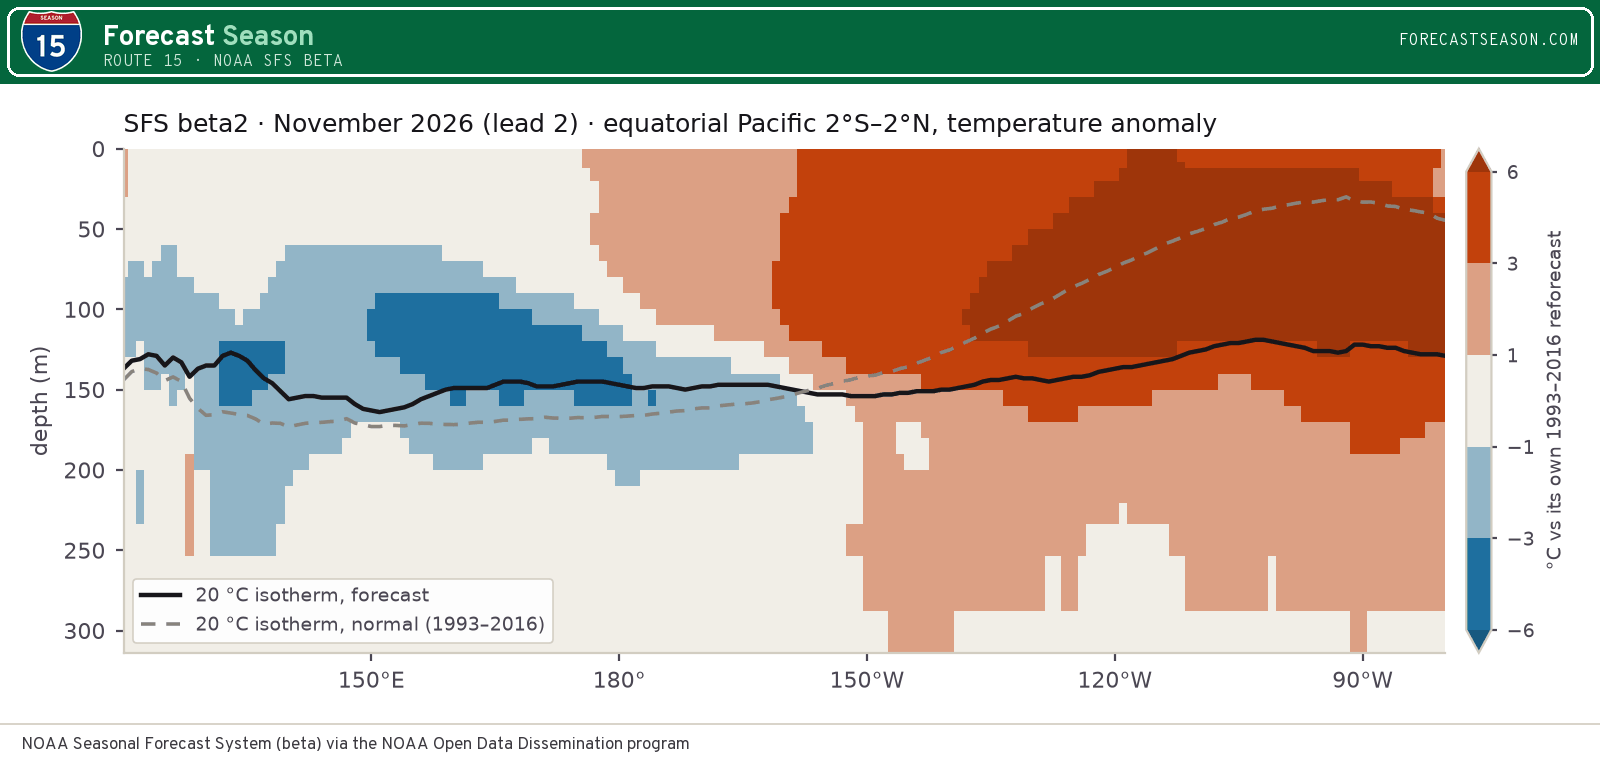
the thermocline a year ahead · both experiments · not scoredThis half is not scored. The Niño indices above are checked against ERA5 lead by lead. Nothing below can be: there is no observed ocean interior on this site to check it against. It is published because the thermocline is where an El Niño is kept alive or starved, and SFS is the only system here that shows it — read it as the model's reasoning, not as a verified forecast.
In October 2026, the part-elapsed first month, the warmest water relative to normal sits below the surface in the east: beta2 +11.8 °C at 75 m near 101°W. That is the thermocline pushed down — warm water piled where cold water normally wells up.
Two ways to watch it end. The 20 °C isotherm in the far east (120°W–90°W) comes back up above its normal depth — beta2 in May 2027. And the equatorial heat content, the fuel an event runs on, drops below normal — beta2 from January 2027. An El Niño that has spent its heat content while the surface is still warm is an event already on its way out, which is the model's case for the decline the Niño 3.4 plume draws.
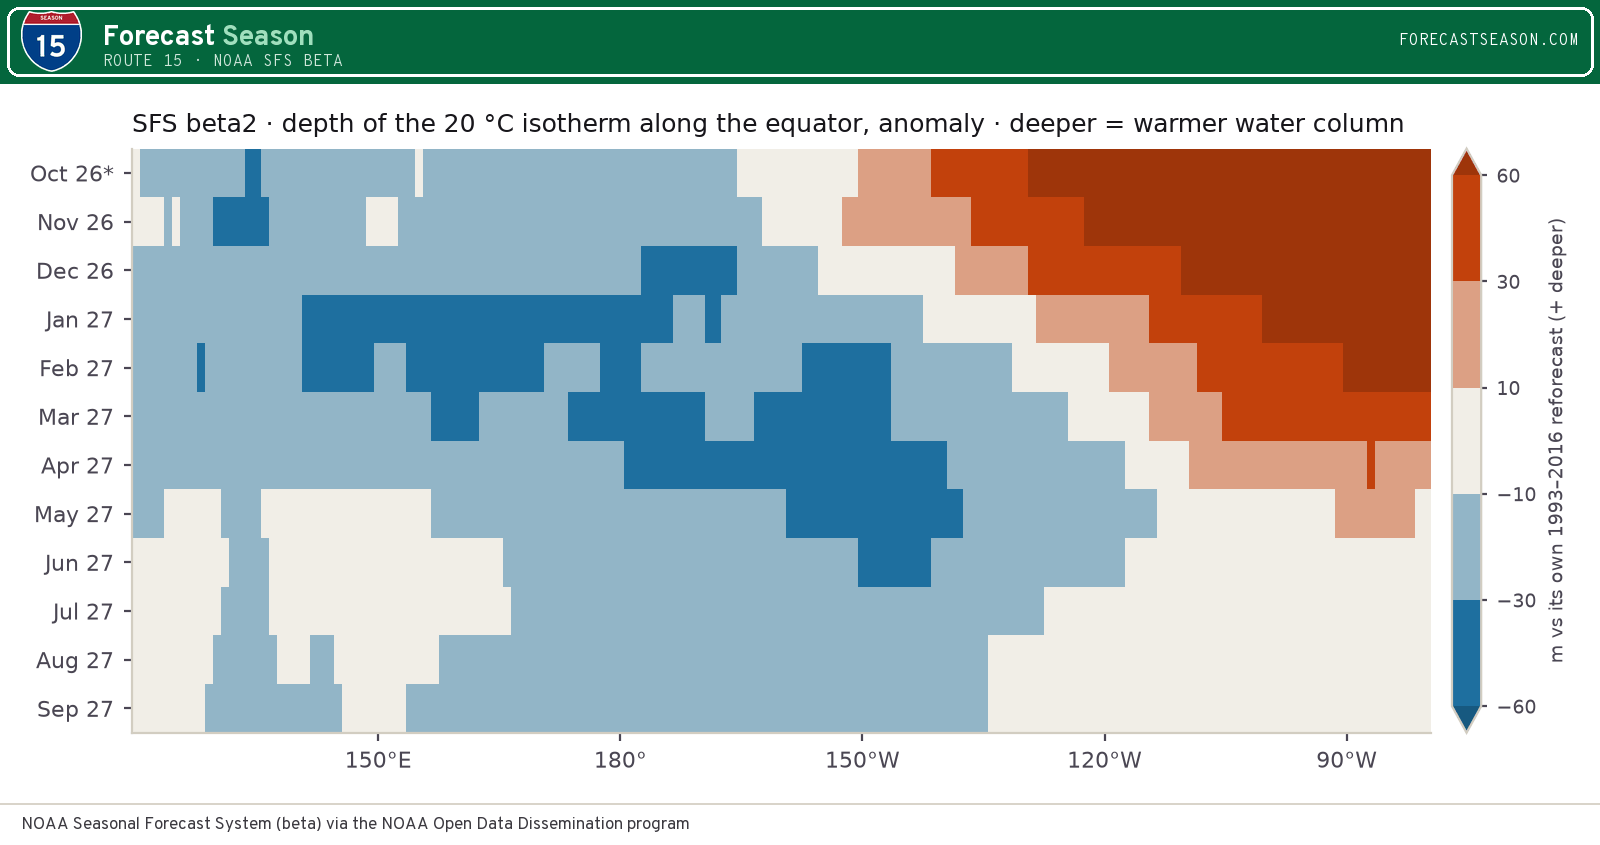
Equatorial heat content 5°S–5°N, 120°E–80°W (20 °C isotherm depth)
Table: the warm-water proxy and the eastern thermocline, every lead
| Target month | Lead | Warm-water proxy beta2 10–90 % | East D20 beta2 |
|---|---|---|---|
| October 2026* | 1 | +12.0 m +12 to +12 | +92 m |
| November 2026 | 2 | +9.3 m +8 to +10 | +80 m |
| December 2026 | 3 | +3.6 m +2 to +6 | +70 m |
| January 2027 | 4 | -1.8 m -4 to +1 | +52 m |
| February 2027 | 5 | -4.8 m -8 to -2 | +38 m |
| March 2027 | 6 | -5.7 m -8 to -4 | +26 m |
| April 2027 | 7 | -5.8 m -8 to -4 | +12 m |
| May 2027 | 8 | -6.2 m -9 to -4 | -2 m |
| June 2027 | 9 | -6.8 m -9 to -4 | -6 m |
| July 2027 | 10 | -7.4 m -10 to -4 | +1 m |
| August 2027 | 11 | -8.7 m -11 to -6 | +5 m |
| September 2027 | 12 | -10.1 m -13 to -7 | +3 m |
Thirty-one members, eleven in the reforecast
what the archive can and cannot supportSFS flies 31 members in real time and 11 in the reforecast. Every probability on this page is therefore as fine-grained as 31 members allow, resting on boundaries and a skill score built from 11 — the same distinction route 02 draws for NASA-GEOSS2S, and the reason the member count alone never tells you what a probability is worth.
Two things about this archive are worth stating plainly because they constrain what the route can publish rather than how it looks. First, the reforecast exists for 2 of the twelve calendar months — January, February, March, April, May, June, July, August, November, December are absent — so a start in one of the missing months has no tercile boundaries, no trend adjustment and no skill, and this route will decline to publish it rather than draw probabilities with nothing behind them. Second, it is a beta: NOAA says so, the operational system is not due until around the end of 2027, and the configuration can change between one start and the next.
| Field | Value |
|---|---|
| Centre | NOAA EMC / PSL |
| System | NOAA Seasonal Forecast System Beta, experiment beta2 — experiment beta2 |
| Live members | 31 |
| Reforecast | 11 members x 35 years (1991–2025) |
| Leads | 12 months |
| Resolution | 0.5° monthly |
| Source | s3://noaa-oar-sfsdev-pds/experiments/beta2/ — public, anonymous, read in place |
| Verification | ERA5 monthly means, interpolated onto the SFS 0.5° grid |
How to read this
Four things it is notStatus
Not an operational forecast
NOAA publishes this as a beta, for evaluation, while the operational SFSv1 is built toward roughly the end of 2027. The configuration may change between one start and the next, and a change would move every number on this page without announcing itself. Nothing here is CPC's official outlook, which is a different product built by people from more than one model.
Ensemble
One model, not a consensus
This is a single coupled system, so the spread on this page is one model's estimate of its own uncertainty and nothing more. Route 03 and route 02 exist precisely because that estimate is the one thing an ensemble cannot check about itself — and the plume above shows this one running narrower than its own reforecast, which is the failure mode to expect.
Grid
Half a degree, and its own
SFS arrives on 361 x 720 half-degree centres; route 10 is on whole degrees and the NMME on a different whole-degree mesh again. This page is therefore not pixel-comparable with any other here without an explicit regrid. As on route 02 the observations are interpolated onto the model, never the model onto a shared grid — you should not resample the forecast when you can resample what it is scored against.
Calibration
Against itself, on a moving baseline
Every probability comes from SFS's own reforecast, never a shared climatology, because a coupled model's drift is its own. The reforecast is nine years more recent than any other on this site and the raw tercile problem is still there, which is the most useful thing this route says about the other three.