The NMME
The multi-model behind CPC's outlooks, and the other half of what route 03 does for Europe. Two independent panels — different centres, different reforecast windows, different grids — asked the same question about the same months. Where they agree, that is worth more than either alone; where they do not, that is worth knowing too. And as on every page here, each model is calibrated against its own past runs and scored before anything is drawn.
Models
Members
Consensus vs CanSIPS-IC4
Agreement
The plate
9 layers · 7 views · 6 months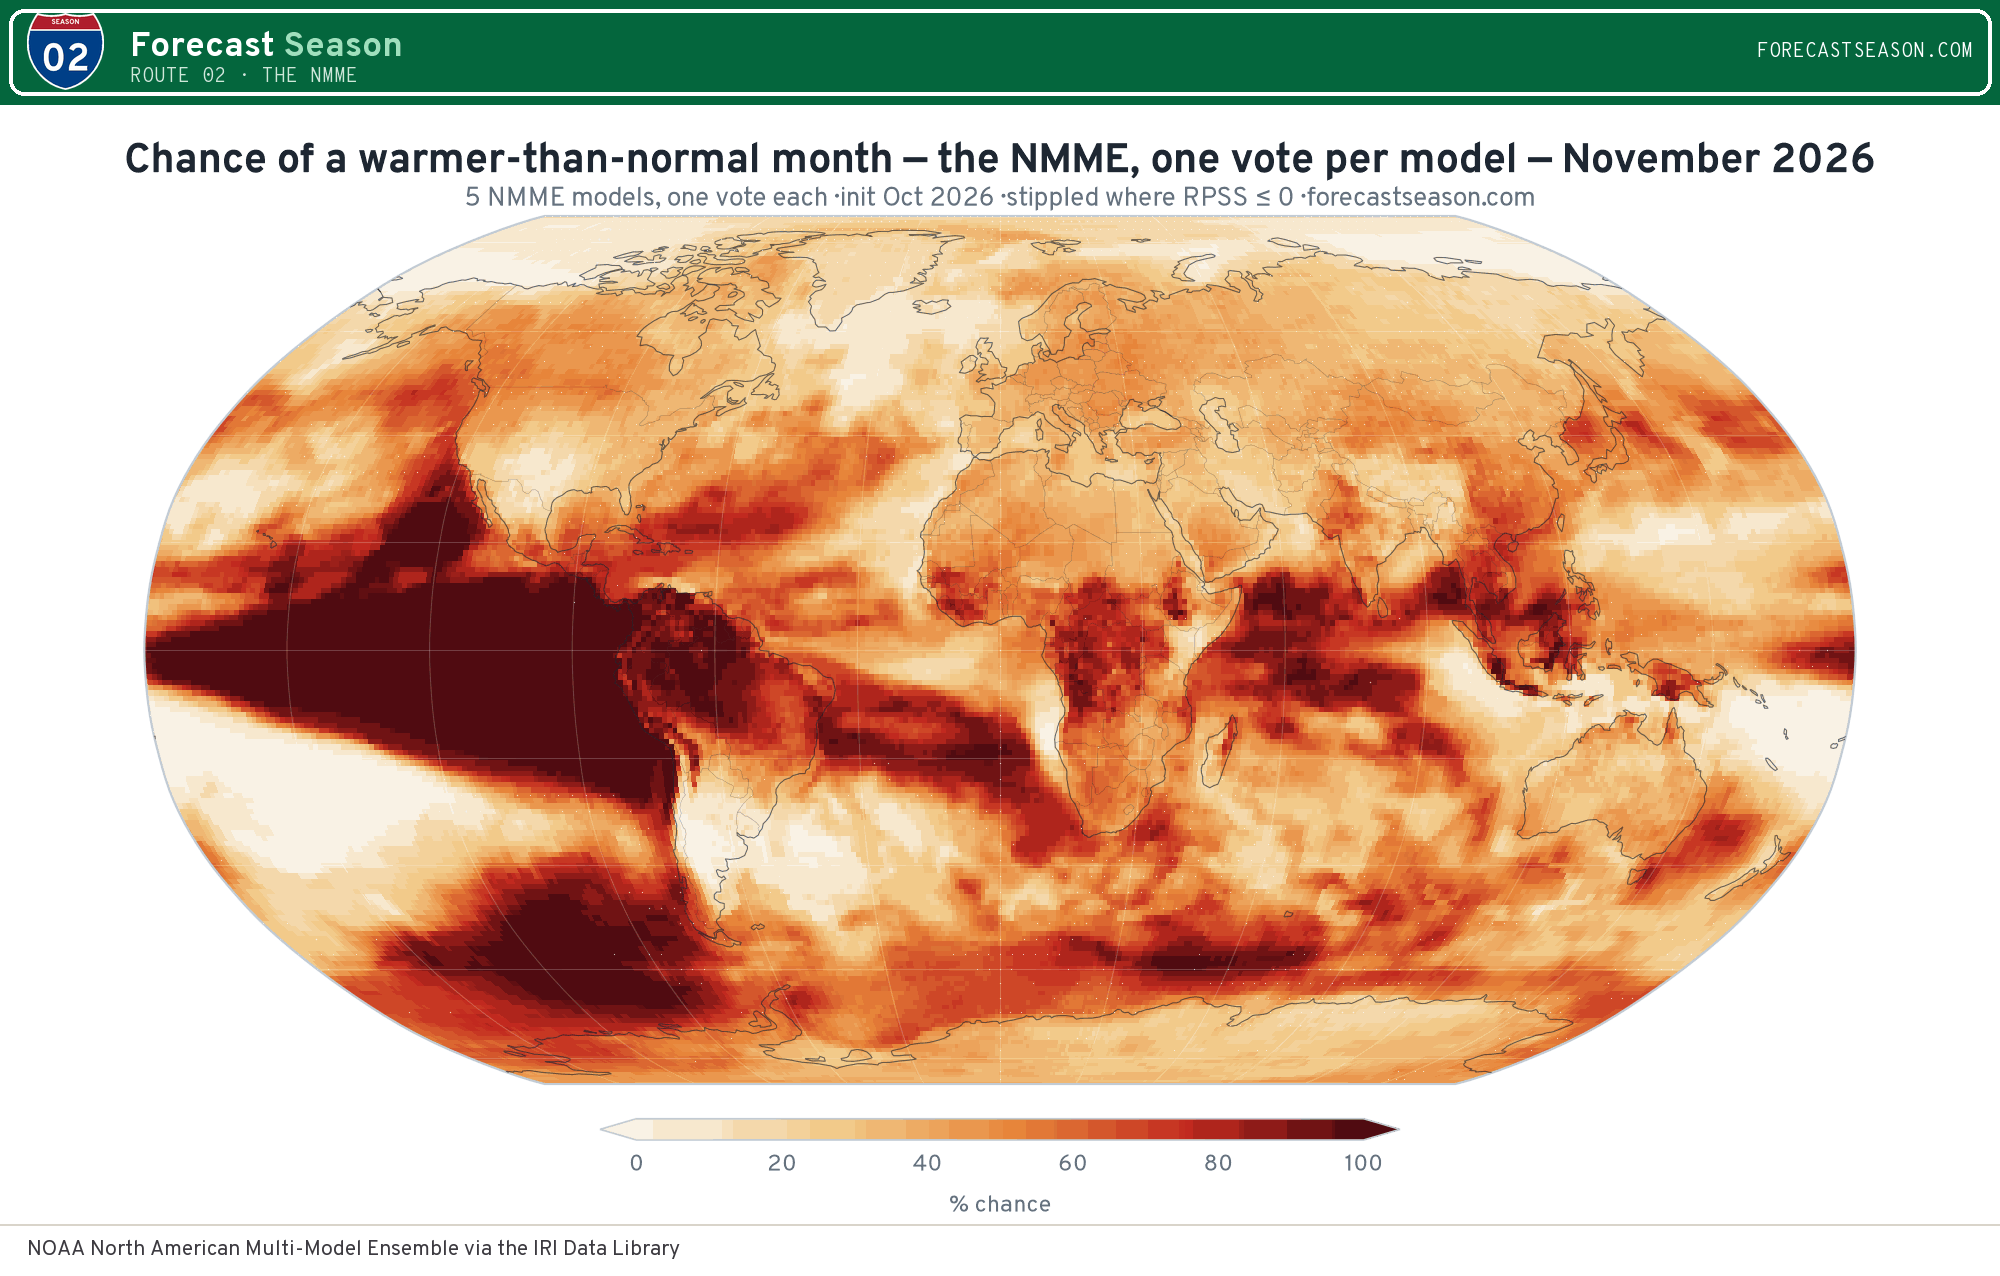
Each model's probability computed inside its own ensemble against its own reforecast, then averaged. Climatology is 33 %. Tercile boundaries moved to today's climate over the common 1991–2016 window.
* Lead 1 is the initialisation's own month, so part of it has already happened. It is kept because the models produced it, not because it is a forecast for days that are over.
Every panel except the skill layers is stippled where the RPSS is zero or below — where issuing these probabilities would be no better than saying nothing. The agreement layer is stippled too, deliberately: models concurring in a place none of them can forecast is exactly the picture that should not go out unmarked.
How many models is the NMME?
fewer than the number quoted"The NMME" is quoted far more often than it is counted. Eight models fly under the banner. Five have both a live forecast and a reforecast on the archive that distributes them — and this initialisation carries 5 of those, 100 members between them. The absent models are named here rather than quietly dropped, because a consensus assembled from models on different initialisations is not a consensus of one forecast.
The one worth singling out is NCEP-CFSv2, the model behind CPC's own headline outlook. Its reforecast on this archive stops in 2010 and it has no forecast series at all, so it cannot be calibrated or scored here — the most widely read NMME model is the one this page cannot include.
| Centre | Model | Live members | Reforecast members | Reforecast years |
|---|---|---|---|---|
| ECCC | CanSIPS-IC4 (CanESM5) | 40 | 40 | 26 |
| GFDL | GFDL-SPEAR | 30 | 15 | 26 |
| NASA | NASA GEOS-S2S | 10 | 4 — probabilities from ten members, skill from four | 26 |
| COLA | COLA-RSMAS-CCSM4 | 10 | 10 | 26 |
| COLA | COLA-RSMAS-CESM1 | 10 | 10 | 26 |
The reforecast column is the one to read. A model can fly more members live than it ever ran in hindcast, which means its probabilities are as fine-grained as the live ensemble allows while the skill behind them rests on far fewer. Member counts also differ enough that pooling members rather than models would let the largest ensemble outvote the rest — hence one model, one vote.
Agreement is not skill
the same warning route 03 carriesWith four models this is a coarser instrument than route 03's ten, and the caution is the same only more so. These models are not independent witnesses: two of the four here are the same institution's two configurations, and all of them share the well-known biases in how coupled models move the tropical ocean. When they agree they may be agreeing on an error, and four agreeing looks much like four being right.
Temperature
| Month | Chance above normal | Models agreeing | Land unanimous | Spread (pts) |
|---|---|---|---|---|
| October 2026 | 49% 44% | 3.3 /5 | 15% | 22 |
| November 2026 | 50% 47% | 3.2 /5 | 16% | 17 |
| December 2026 | 53% 52% | 3.4 /5 | 25% | 16 |
| January 2027 | 55% 55% | 3.5 /5 | 27% | 18 |
| February 2027 | 56% 57% | 3.7 /5 | 29% | 16 |
| March 2027 | 56% 58% | 3.8 /5 | 28% | 17 |
Rainfall
| Month | Chance above normal | Models agreeing | Land unanimous | Spread (pts) |
|---|---|---|---|---|
| October 2026 | 37% 34% | 3.4 /5 | 17% | 18 |
| November 2026 | 37% 37% | 3.1 /5 | 8% | 16 |
| December 2026 | 37% 34% | 3.1 /5 | 10% | 15 |
| January 2027 | 36% 36% | 3.3 /5 | 14% | 14 |
| February 2027 | 36% 35% | 3.1 /5 | 10% | 15 |
| March 2027 | 37% 37% | 3.1 /5 | 9% | 14 |
Every probability on this page is scored against tercile boundaries moved from the reforecast period to today's climate, using each model's own warming. That assumption is worth seeing rather than taking on trust: across these models the reforecasts warm by +0.37 to +0.52 °C per decade over land, which shifts their boundaries by roughly +0.8 to +1.2 °C between the middle of 1991–2016 and now.
The upper end of that is faster than the observed record over the same years — COLA-RSMAS-CCSM4 warms quickest here — and the consequence runs one way: a model that warms faster than reality has its boundaries shifted too far, and its chance of an above-normal month comes out too low. This is the mirror of the problem route 10 documents, where not adjusting at all made every month look warm. Neither panel is a correction of the other; both are stated so the assumption is visible.
"Models agreeing" counts how many put their highest probability on the same tercile as the published consensus, averaged over land. The floor is not zero but roughly 1.7 — with three categories and no signal at all, a third of the models land on the same one by chance.
The scoreboard
1991–2016 reforecasts vs ERA5 · n=26Every model scored inside one leave-one-out, over land: for each held-out year each model's tercile boundaries are rebuilt from its own other 25 reforecast years before the votes are averaged. The benchmark column is CanSIPS-IC4, chosen in advance because it is the largest ensemble here and the one a reader with a single NMME model in front of them is most likely to have — not chosen because it scored well. The best single model in each row is marked separately.
Temperature
| Month | CanSIPS-IC4 | GFDL-SPEAR | NASA-GEOSS2S | COLA-RSMAS-CCSM4 | COLA-RSMAS-CESM1 | Consensus | vs best | Beat it |
|---|---|---|---|---|---|---|---|---|
| October 2026 | +0.207 | +0.090 | -0.029 | +0.120 | +0.136 | +0.256 | +0.049 | 0 |
| November 2026 | +0.070 | +0.010 | -0.133 | -0.011 | -0.008 | +0.096 | +0.025 | 0 |
| December 2026 | +0.053 | -0.009 | -0.184 | -0.067 | -0.057 | +0.054 | +0.001 | 0 |
| January 2027 | +0.065 | -0.028 | -0.143 | -0.081 | -0.036 | +0.059 | -0.006 | 1 |
| February 2027 | +0.085 | +0.034 | -0.092 | -0.007 | +0.008 | +0.103 | +0.019 | 0 |
| March 2027 | +0.067 | +0.021 | -0.146 | -0.030 | +0.002 | +0.083 | +0.016 | 0 |
Rainfall
| Month | CanSIPS-IC4 | GFDL-SPEAR | NASA-GEOSS2S | COLA-RSMAS-CCSM4 | COLA-RSMAS-CESM1 | Consensus | vs best | Beat it |
|---|---|---|---|---|---|---|---|---|
| October 2026 | +0.105 | -0.028 | -0.143 | -0.049 | -0.016 | +0.114 | +0.009 | 0 |
| November 2026 | +0.010 | -0.040 | -0.195 | -0.102 | -0.091 | +0.017 | +0.008 | 0 |
| December 2026 | +0.018 | -0.028 | -0.225 | -0.100 | -0.071 | +0.020 | +0.002 | 0 |
| January 2027 | +0.009 | -0.059 | -0.240 | -0.097 | -0.091 | +0.003 | -0.006 | 1 |
| February 2027 | +0.009 | -0.052 | -0.227 | -0.085 | -0.092 | +0.006 | -0.002 | 1 |
| March 2027 | -0.006 | -0.052 | -0.253 | -0.106 | -0.103 | -0.008 | -0.002 | 1 |
Pooling does not always pay, and here it often does not. The consensus loses to the best single model at 4 of the 10 full scorings on this page — including 3 of the 5 rainfall leads outright. Route 03 found the reverse for the C3S systems, where the consensus beat every one of its ten at every lead.
The reason is in the scoreboard rather than in the method. In November 2026, CanSIPS-IC4 scores +0.070 over land while 3 of the 5 models score zero or below — a forecast worse than saying nothing. Averaging one good model with several poor ones dilutes it, which is precisely what route 11 found when it blended this site's two engines: when one source is clearly better, averaging it with a weaker one throws skill away.
So the three routes agree on something more useful than any of them says alone: multi-model averaging pays when the members are of comparable quality and costs when one of them dominates. The NMME here is the second case. That is an argument for reading the scoreboard before the map, not for ignoring the ensemble.
Twenty-six years is not many, and a per-model RPSS from 26 cases is noisy — the ranking between two close models is not meaningful, though the gap between the consensus and the field usually is. These numbers sit on the NMME's own whole-degree grid over a 1991–2016 window, where route 03's sit on a half-degree grid over 1993–2016. The two are comparable in kind, not to the third decimal.
How to read this
Four things it is notCoverage
Not the whole NMME
This is the part of the ensemble that can be calibrated and scored: models with a reforecast long enough to build tercile boundaries and measure skill against. CPC's own realtime feed carries more models than this page does, and no reforecast at all — which would mean probabilities with nothing behind them and no way to say whether they have ever verified.
Independence
Fewer minds than models
Two of the models here are one institution's two configurations, sharing components outright. Treating the count of agreeing models as a sample size — as though three of four were three independent confirmations — overstates the evidence considerably at this ensemble size.
Grid
Not route 03's
The NMME arrives on whole degrees; the C3S archive on half-degree centres. This page therefore is not pixel-comparable with the multi-system without an explicit regrid. The observations are interpolated onto the models here rather than the models onto a shared grid, because you should never resample the forecast when you can resample the thing it is scored against.
Calibration
Each against itself
Every model's probabilities come from its own reforecast over the common 1991–2016 window — not a shared climatology, and not each model's own longest record. A coupled model's drift is its own; but scoring them over different periods and different sample sizes would not be a comparison.