Degree days
How much heating and cooling the season will ask for, from every one of SEAS5's 51 members — each member's daily high and low turned into a daily degree day, summed by month, weighted by where people live. Corrected against the observed record, and checked against last winter.
US heating, Nov–Mar
Europe heating, Nov–Mar
US winter in the cold third
Last winter's error, US
What the forecast says
SEAS5 started October 2026 · 51 membersThe lower 48. The corrected median puts November–March heating demand at 3,114 °F-days, 96% of the 1991–2020 normal, with 80% of members between 2,784 and 3,319. 23 of the 35 winters since 1991/92 needed at least that much; last winter took 3,008.
Europe. The corrected median puts November–March heating demand at 1,881 °C-days, 93% of the 1991–2020 normal, with 80% of members between 1,737 and 2,097. 29 of the 35 winters since 1991/92 needed at least that much; last winter took 1,898.
Month by month. For the US the mildest month relative to normal is April 2027 (81% of normal heating demand) and the closest to a cold month is February 2027 (96%). Every month's spread across members is wider than its shift from normal — this is a tilt, not a certainty.
Last winter as a check. Across the 18 months the three 2025 runs covered, the corrected US median missed observed heating demand by 6% on average, against 11% before correction; the observed value fell inside the members' 10–90% range in 94% of months. The correction is doing its job.
Month by month
every member, against the recordEvery region
corrected median as a share of normal| Oct 2026 | Nov 2026 | Dec 2026 | Jan 2027 | Feb 2027 | Mar 2027 | Apr 2027 | Nov–Mar | |
|---|---|---|---|---|---|---|---|---|
| North America · °F-days | ||||||||
| United States (lower 48)341.7 M people · 934 cells | 90%195 | 94%442 | 94%681 | 94%767 | 96%658 | 92%515 | 81%260 | 96%3,114 |
| New England15.3 M people · 36 cells | 110%407 | 95%629 | 93%917 | 92%1,078 | 91%939 | 86%803 | 77%458 | 90%4,346 |
| Middle Atlantic42.6 M people · 46 cells | 108%332 | 96%577 | 93%838 | 93%1,007 | 91%871 | 88%738 | 77%387 | 93%4,072 |
| East North Central49.7 M people · 111 cells | 97%343 | 99%682 | 96%985 | 92%1,108 | 93%961 | 88%752 | 78%389 | 93%4,504 |
| West North Central20.9 M people · 168 cells | 82%304 | 96%707 | 96%1,070 | 92%1,171 | 96%1,003 | 91%737 | 75%336 | 95%4,758 |
| South Atlantic68.0 M people · 104 cells | 93%102 | 95%282 | 98%467 | 101%570 | 101%458 | 94%320 | 84%124 | 98%2,098 |
| East South Central19.7 M people · 60 cells | 67%97 | 94%377 | 101%642 | 102%749 | 105%607 | 101%429 | 86%160 | 102%2,830 |
| West South Central43.7 M people · 142 cells | 27 | 101%226 | 106%452 | 103%500 | 110%384 | 98%207 | 69%48 | 106%1,805 |
| Mountain26.3 M people · 252 cells | 71%237 | 96%593 | 94%848 | 94%853 | 103%770 | 104%642 | 84%367 | 98%3,729 |
| Pacific55.5 M people · 116 cells | 66%108 | 86%321 | 84%482 | 85%487 | 96%462 | 92%394 | 81%248 | 88%2,149 |
| Canada37.5 M people · 1818 cells | 95%534 | 97%881 | 90%1,142 | 90%1,305 | 89%1,127 | 87%979 | 80%587 | 90%5,452 |
| Europe · °C-days | ||||||||
| Europe (EU, UK, Norway, Switzerland)497.2 M people · 846 cells | 78%151 | 94%305 | 91%403 | 93%446 | 90%374 | 98%361 | 92%226 | 93%1,881 |
| Germany82.9 M people · 64 cells | 78%186 | 94%356 | 89%439 | 93%487 | 89%409 | 99%398 | 95%252 | 94%2,114 |
| France62.1 M people · 87 cells | 77%119 | 93%275 | 89%354 | 90%382 | 89%332 | 99%318 | 93%211 | 92%1,665 |
| United Kingdom62.3 M people · 58 cells | 80%173 | 95%299 | 92%367 | 94%389 | 94%351 | 95%348 | 91%264 | 94%1,753 |
| Italy52.6 M people · 62 cells | 66%68 | 94%224 | 88%330 | 91%373 | 89%316 | 93%277 | 84%155 | 90%1,512 |
| Spain39.9 M people · 73 cells | 82%49 | 89%171 | 91%266 | 84%273 | 84%231 | 96%219 | 87%132 | 87%1,143 |
| Poland39.4 M people · 55 cells | 82%218 | 97%400 | 91%501 | 94%563 | 94%488 | 95%437 | 92%254 | 94%2,394 |
| Netherlands16.4 M people · 11 cells | 79%148 | 92%285 | 91%375 | 92%406 | 91%362 | 98%357 | 98%251 | 94%1,808 |
| Nordics24.9 M people · 269 cells | 85%283 | 98%444 | 93%528 | 99%613 | 101%574 | 97%527 | 95%375 | 98%2,709 |
| Oct 2026 | Nov 2026 | Dec 2026 | Jan 2027 | Feb 2027 | Mar 2027 | Apr 2027 | ||
|---|---|---|---|---|---|---|---|---|
| North America · °F-days | ||||||||
| United States (lower 48)341.7 M people · 934 cells | 126%92 | 21 | 7 | 4 | 5 | 13 | 52 | |
| New England15.3 M people · 36 cells | 2 | 0 | 0 | 0 | 0 | 0 | 0 | |
| Middle Atlantic42.6 M people · 46 cells | 5 | 0 | 0 | 0 | 0 | 0 | 2 | |
| East North Central49.7 M people · 111 cells | 7 | 0 | 0 | 0 | 0 | 0 | 8 | |
| West North Central20.9 M people · 168 cells | 12 | 0 | 0 | 0 | 0 | 0 | 13 | |
| South Atlantic68.0 M people · 104 cells | 104%143 | 64 | 30 | 15 | 20 | 41 | 115%109 | |
| East South Central19.7 M people · 60 cells | 134%95 | 10 | 0 | 0 | 0 | 4 | 44 | |
| West South Central43.7 M people · 142 cells | 101%178 | 41 | 8 | 4 | 7 | 34 | 130%150 | |
| Mountain26.3 M people · 252 cells | 129%95 | 7 | 0 | 0 | 0 | 5 | 55 | |
| Pacific55.5 M people · 116 cells | 152 | 10 | 1 | 0 | 0 | 1 | 15 | |
| Canada37.5 M people · 1818 cells | 0 | 0 | 0 | 0 | 0 | 0 | 0 | |
| Europe · °C-days | ||||||||
| Europe (EU, UK, Norway, Switzerland)497.2 M people · 846 cells | 0 | 0 | 0 | 0 | 0 | 0 | 0 | |
| Germany82.9 M people · 64 cells | 0 | 0 | 0 | 0 | 0 | 0 | 0 | |
| France62.1 M people · 87 cells | 0 | 0 | 0 | 0 | 0 | 0 | 0 | |
| United Kingdom62.3 M people · 58 cells | 0 | 0 | 0 | 0 | 0 | 0 | 0 | |
| Italy52.6 M people · 62 cells | 0 | 0 | 0 | 0 | 0 | 0 | 0 | |
| Spain39.9 M people · 73 cells | 2 | 0 | 0 | 0 | 0 | 0 | 0 | |
| Poland39.4 M people · 55 cells | 0 | 0 | 0 | 0 | 0 | 0 | 0 | |
| Netherlands16.4 M people · 11 cells | 0 | 0 | 0 | 0 | 0 | 0 | 0 | |
| Nordics24.9 M people · 269 cells | 0 | 0 | 0 | 0 | 0 | 0 | 0 | |
| Oct 2026 | Nov 2026 | Dec 2026 | Jan 2027 | Feb 2027 | Mar 2027 | Apr 2027 | Nov–Mar | |
|---|---|---|---|---|---|---|---|---|
| North America · °F-days | ||||||||
| United States (lower 48)341.7 M people · 934 cells | 80%262 | 95%594 | 95%871 | 94%937 | 97%809 | 94%641 | 80%343 | 97%3,932 |
| New England15.3 M people · 36 cells | 105%522 | 95%775 | 92%1,089 | 89%1,253 | 90%1,108 | 88%956 | 83%590 | 91%5,205 |
| Middle Atlantic42.6 M people · 46 cells | 103%415 | 97%689 | 94%982 | 93%1,138 | 93%994 | 88%830 | 79%446 | 92%4,625 |
| East North Central49.7 M people · 111 cells | 97%383 | 98%723 | 94%1,026 | 91%1,170 | 91%1,008 | 88%817 | 79%451 | 92%4,724 |
| West North Central20.9 M people · 168 cells | 82%341 | 97%774 | 94%1,110 | 93%1,221 | 96%1,046 | 92%806 | 78%397 | 96%5,052 |
| South Atlantic68.0 M people · 104 cells | 93%112 | 95%306 | 100%515 | 102%614 | 103%496 | 97%352 | 84%134 | 99%2,274 |
| East South Central19.7 M people · 60 cells | 66%83 | 95%350 | 102%613 | 103%708 | 106%571 | 103%397 | 84%137 | 102%2,651 |
| West South Central43.7 M people · 142 cells | 61%45 | 102%278 | 102%507 | 101%554 | 109%444 | 97%247 | 73%69 | 106%2,104 |
| Mountain26.3 M people · 252 cells | 72%335 | 96%774 | 95%1,066 | 94%1,074 | 100%959 | 100%816 | 85%491 | 97%4,716 |
| Pacific55.5 M people · 116 cells | 69%235 | 92%568 | 88%753 | 89%758 | 97%695 | 92%595 | 81%395 | 91%3,359 |
| Canada37.5 M people · 1818 cells | 95%987 | 95%1,424 | 91%1,758 | 92%1,978 | 90%1,685 | 88%1,555 | 85%1,072 | 91%8,404 |
| Europe · °C-days | ||||||||
| Europe (EU, UK, Norway, Switzerland)497.2 M people · 846 cells | 83%207 | 95%367 | 92%470 | 94%516 | 94%456 | 98%425 | 92%278 | 94%2,232 |
| Germany82.9 M people · 64 cells | 77%191 | 94%362 | 90%449 | 94%501 | 90%420 | 99%409 | 94%256 | 94%2,154 |
| France62.1 M people · 87 cells | 76%121 | 93%280 | 89%361 | 90%388 | 89%339 | 98%322 | 92%218 | 92%1,694 |
| United Kingdom62.3 M people · 58 cells | 86%204 | 97%316 | 92%377 | 93%392 | 95%363 | 95%362 | 94%292 | 95%1,822 |
| Italy52.6 M people · 62 cells | 72%79 | 94%225 | 88%331 | 90%370 | 88%317 | 93%287 | 85%171 | 91%1,541 |
| Spain39.9 M people · 73 cells | 84%77 | 92%218 | 91%306 | 86%314 | 86%267 | 98%257 | 87%163 | 88%1,334 |
| Poland39.4 M people · 55 cells | 83%220 | 98%404 | 91%501 | 94%566 | 94%488 | 96%440 | 94%261 | 94%2,391 |
| Netherlands16.4 M people · 11 cells | 79%153 | 93%291 | 91%380 | 92%413 | 91%363 | 98%360 | 98%251 | 94%1,829 |
| Nordics24.9 M people · 269 cells | 86%386 | 98%567 | 94%658 | 101%763 | 100%690 | 96%631 | 93%461 | 98%3,318 |
| Oct 2026 | Nov 2026 | Dec 2026 | Jan 2027 | Feb 2027 | Mar 2027 | Apr 2027 | ||
|---|---|---|---|---|---|---|---|---|
| North America · °F-days | ||||||||
| United States (lower 48)341.7 M people · 934 cells | 56 | 10 | 2 | 1 | 2 | 7 | 39 | |
| New England15.3 M people · 36 cells | 1 | 0 | 0 | 0 | 0 | 0 | 0 | |
| Middle Atlantic42.6 M people · 46 cells | 3 | 0 | 0 | 0 | 0 | 0 | 2 | |
| East North Central49.7 M people · 111 cells | 6 | 0 | 0 | 0 | 0 | 0 | 7 | |
| West North Central20.9 M people · 168 cells | 8 | 0 | 0 | 0 | 0 | 0 | 9 | |
| South Atlantic68.0 M people · 104 cells | 99%114 | 44 | 17 | 8 | 11 | 26 | 117%88 | |
| East South Central19.7 M people · 60 cells | 132%111 | 13 | 0 | 0 | 0 | 6 | 54 | |
| West South Central43.7 M people · 142 cells | 98%145 | 29 | 5 | 3 | 5 | 26 | 134%136 | |
| Mountain26.3 M people · 252 cells | 23 | 2 | 0 | 0 | 0 | 2 | 18 | |
| Pacific55.5 M people · 116 cells | 80 | 4 | 0 | 0 | 0 | 2 | 20 | |
| Canada37.5 M people · 1818 cells | 0 | 0 | 0 | 0 | 0 | 0 | 0 | |
| Europe · °C-days | ||||||||
| Europe (EU, UK, Norway, Switzerland)497.2 M people · 846 cells | 0 | 0 | 0 | 0 | 0 | 0 | 0 | |
| Germany82.9 M people · 64 cells | 0 | 0 | 0 | 0 | 0 | 0 | 0 | |
| France62.1 M people · 87 cells | 0 | 0 | 0 | 0 | 0 | 0 | 0 | |
| United Kingdom62.3 M people · 58 cells | 0 | 0 | 0 | 0 | 0 | 0 | 0 | |
| Italy52.6 M people · 62 cells | 0 | 0 | 0 | 0 | 0 | 0 | 0 | |
| Spain39.9 M people · 73 cells | 2 | 0 | 0 | 0 | 0 | 0 | 0 | |
| Poland39.4 M people · 55 cells | 0 | 0 | 0 | 0 | 0 | 0 | 0 | |
| Netherlands16.4 M people · 11 cells | 0 | 0 | 0 | 0 | 0 | 0 | 0 | |
| Nordics24.9 M people · 269 cells | 0 | 0 | 0 | 0 | 0 | 0 | 0 | |
Each cell: the corrected median as a share of the 1991–2020 normal, with the value itself underneath. Hover for the 10–90% range and the chance of landing below, near or above normal (the terciles of the 30 observed years). Cooling cells are coloured the other way round: rust is more cooling demand. A month with almost no normal demand (under 60 °F-days or 20 °C-days) shows the value alone. Controls above choose HDD/CDD and the weighting.
Maps
departure from normal, land only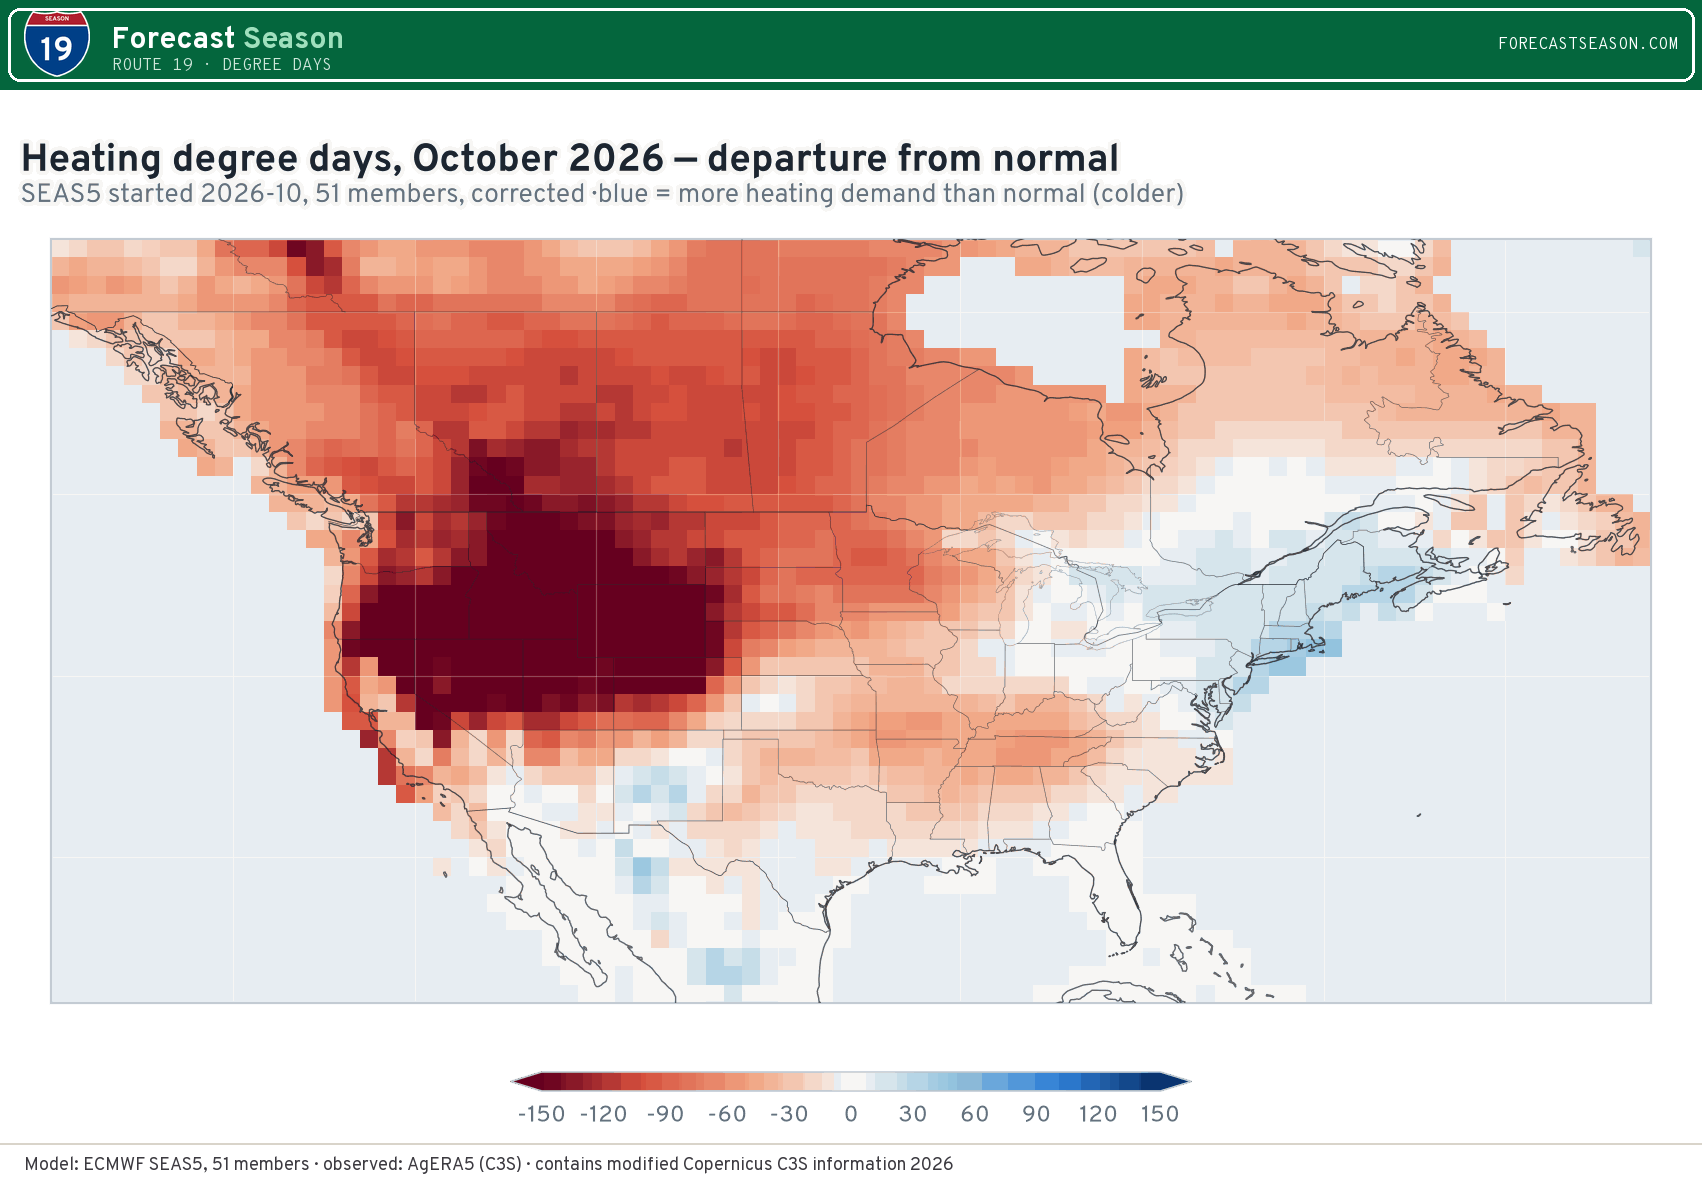
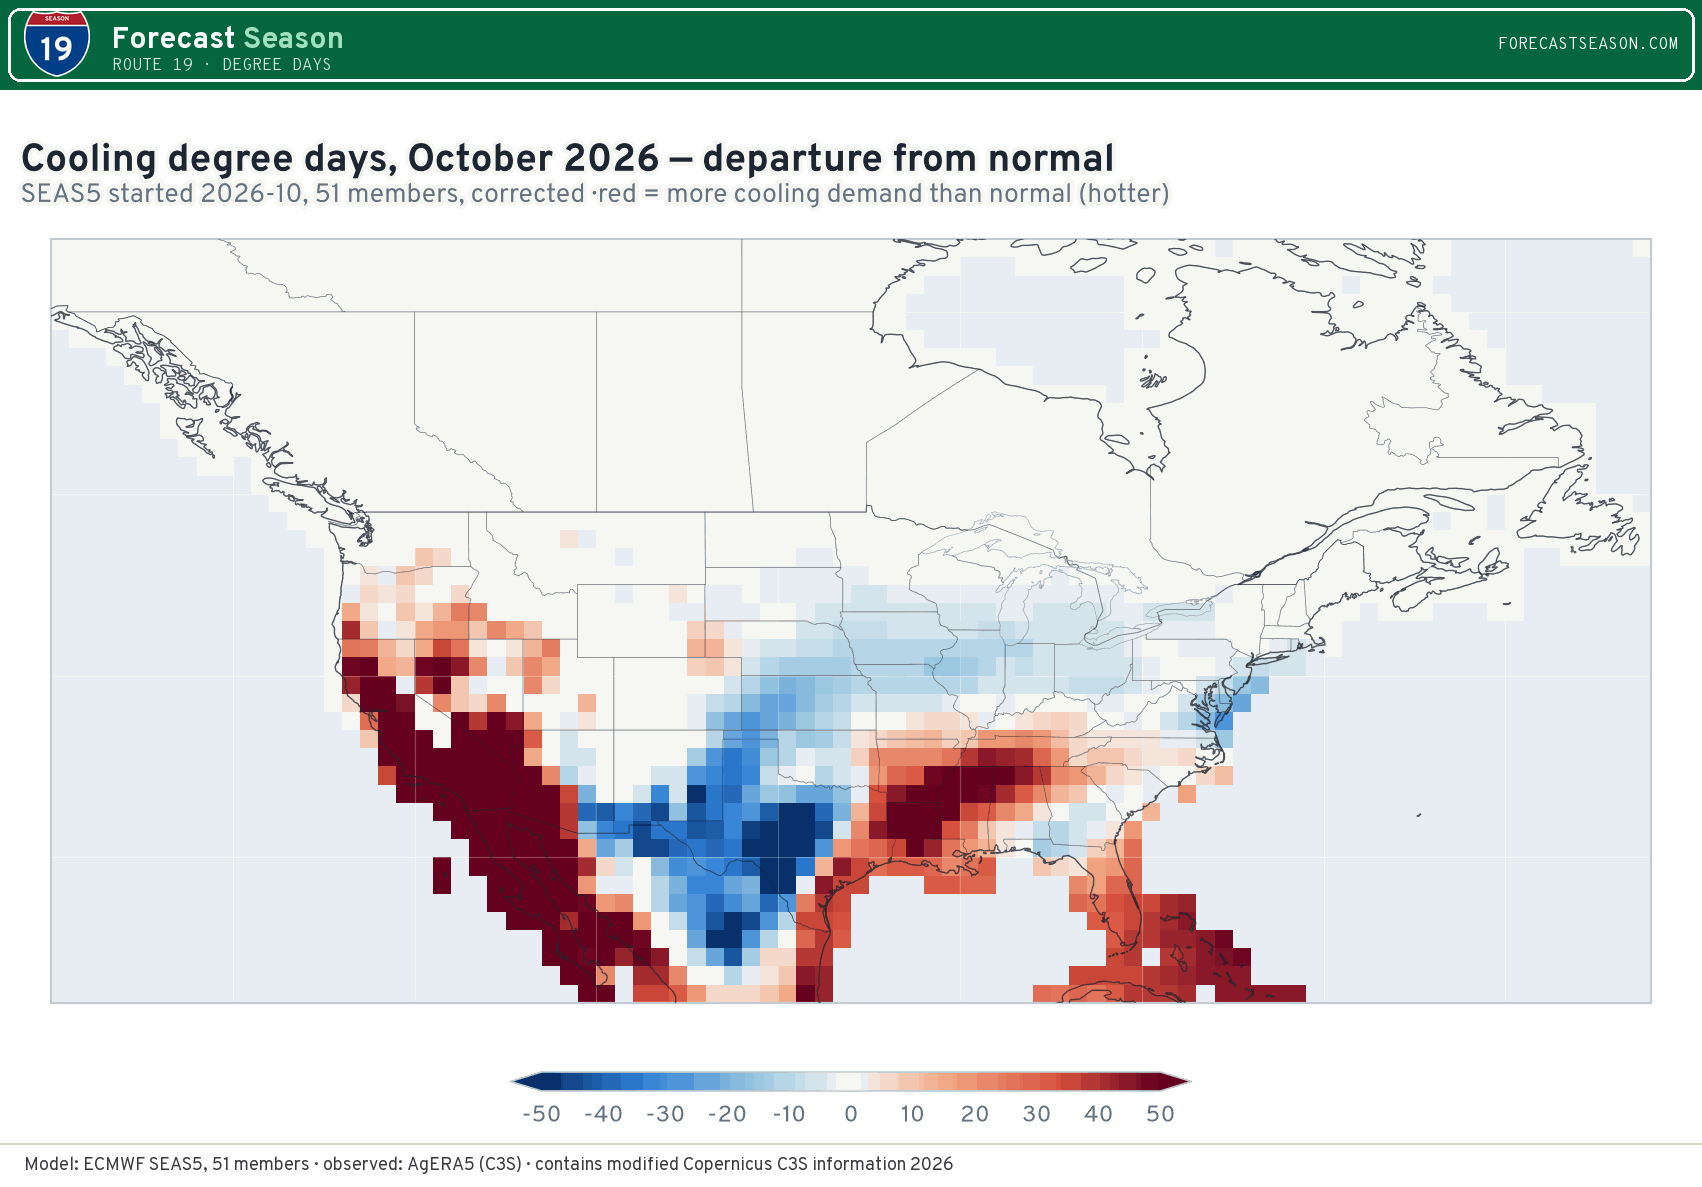
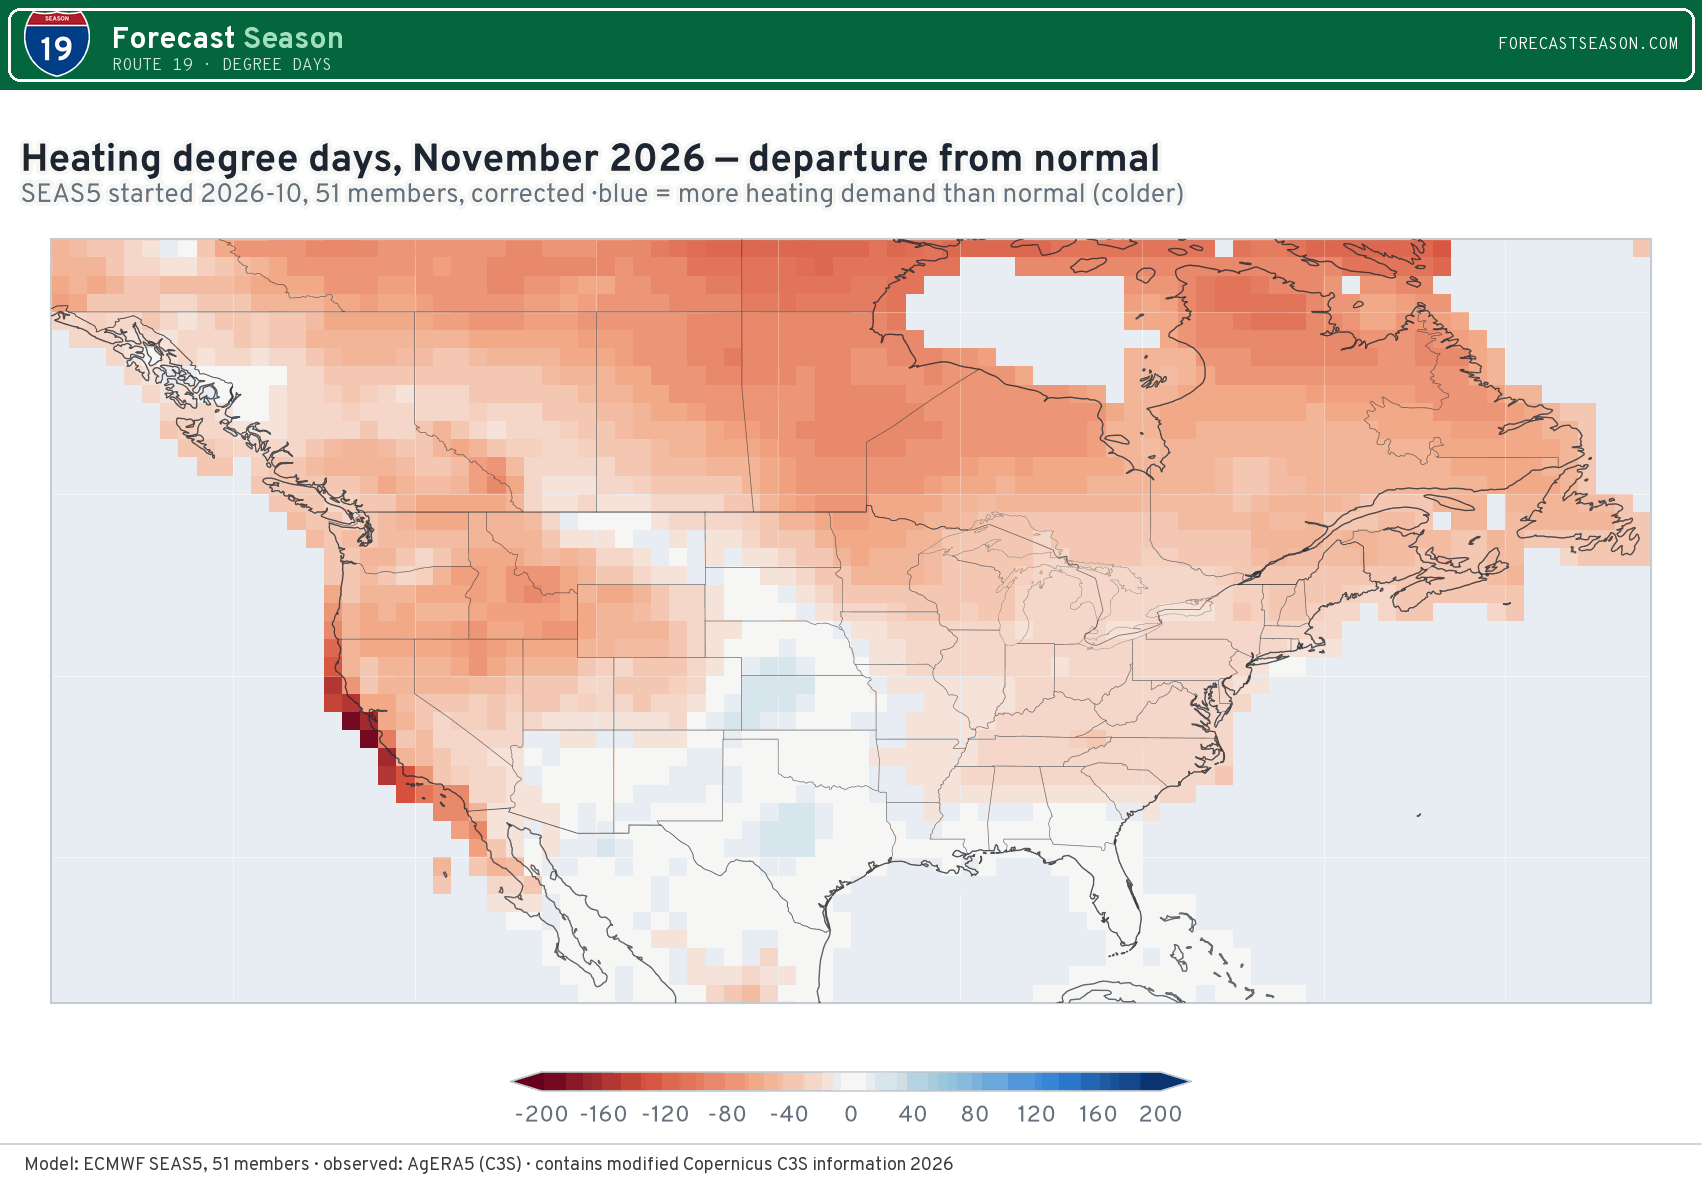
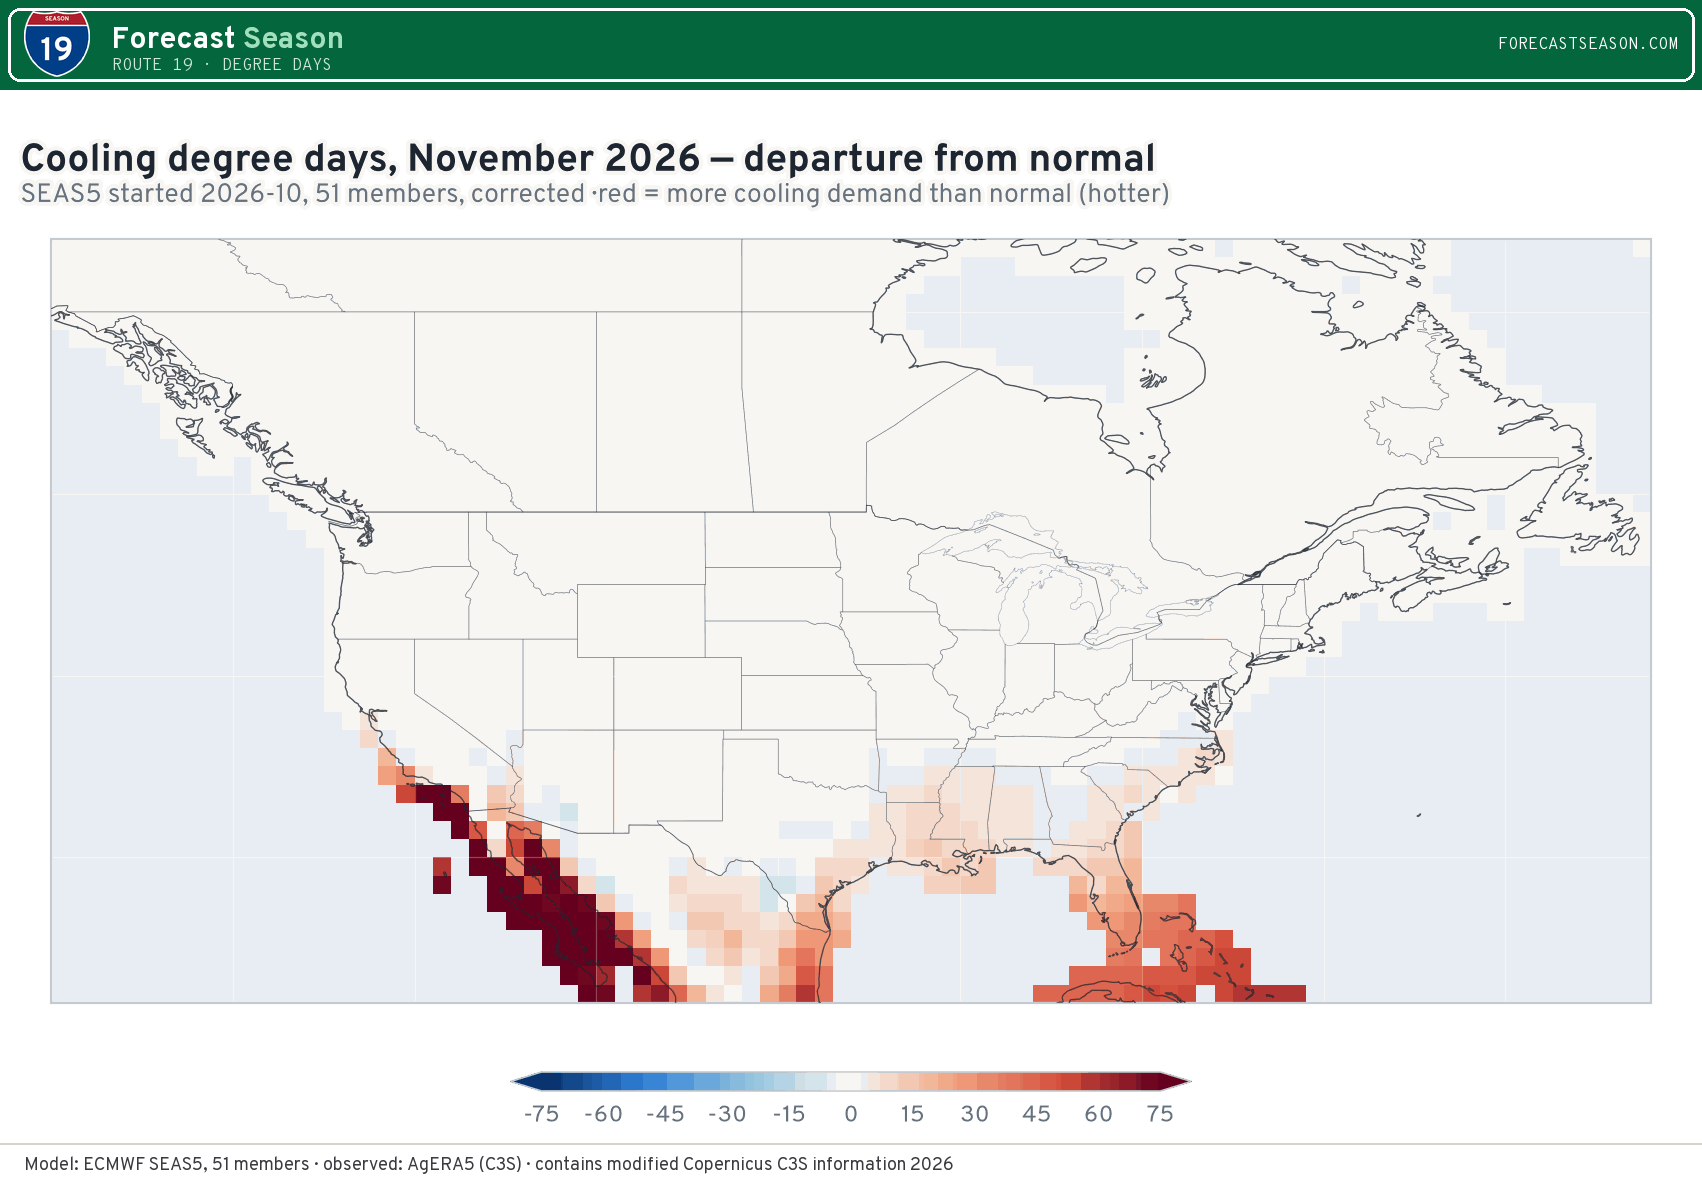
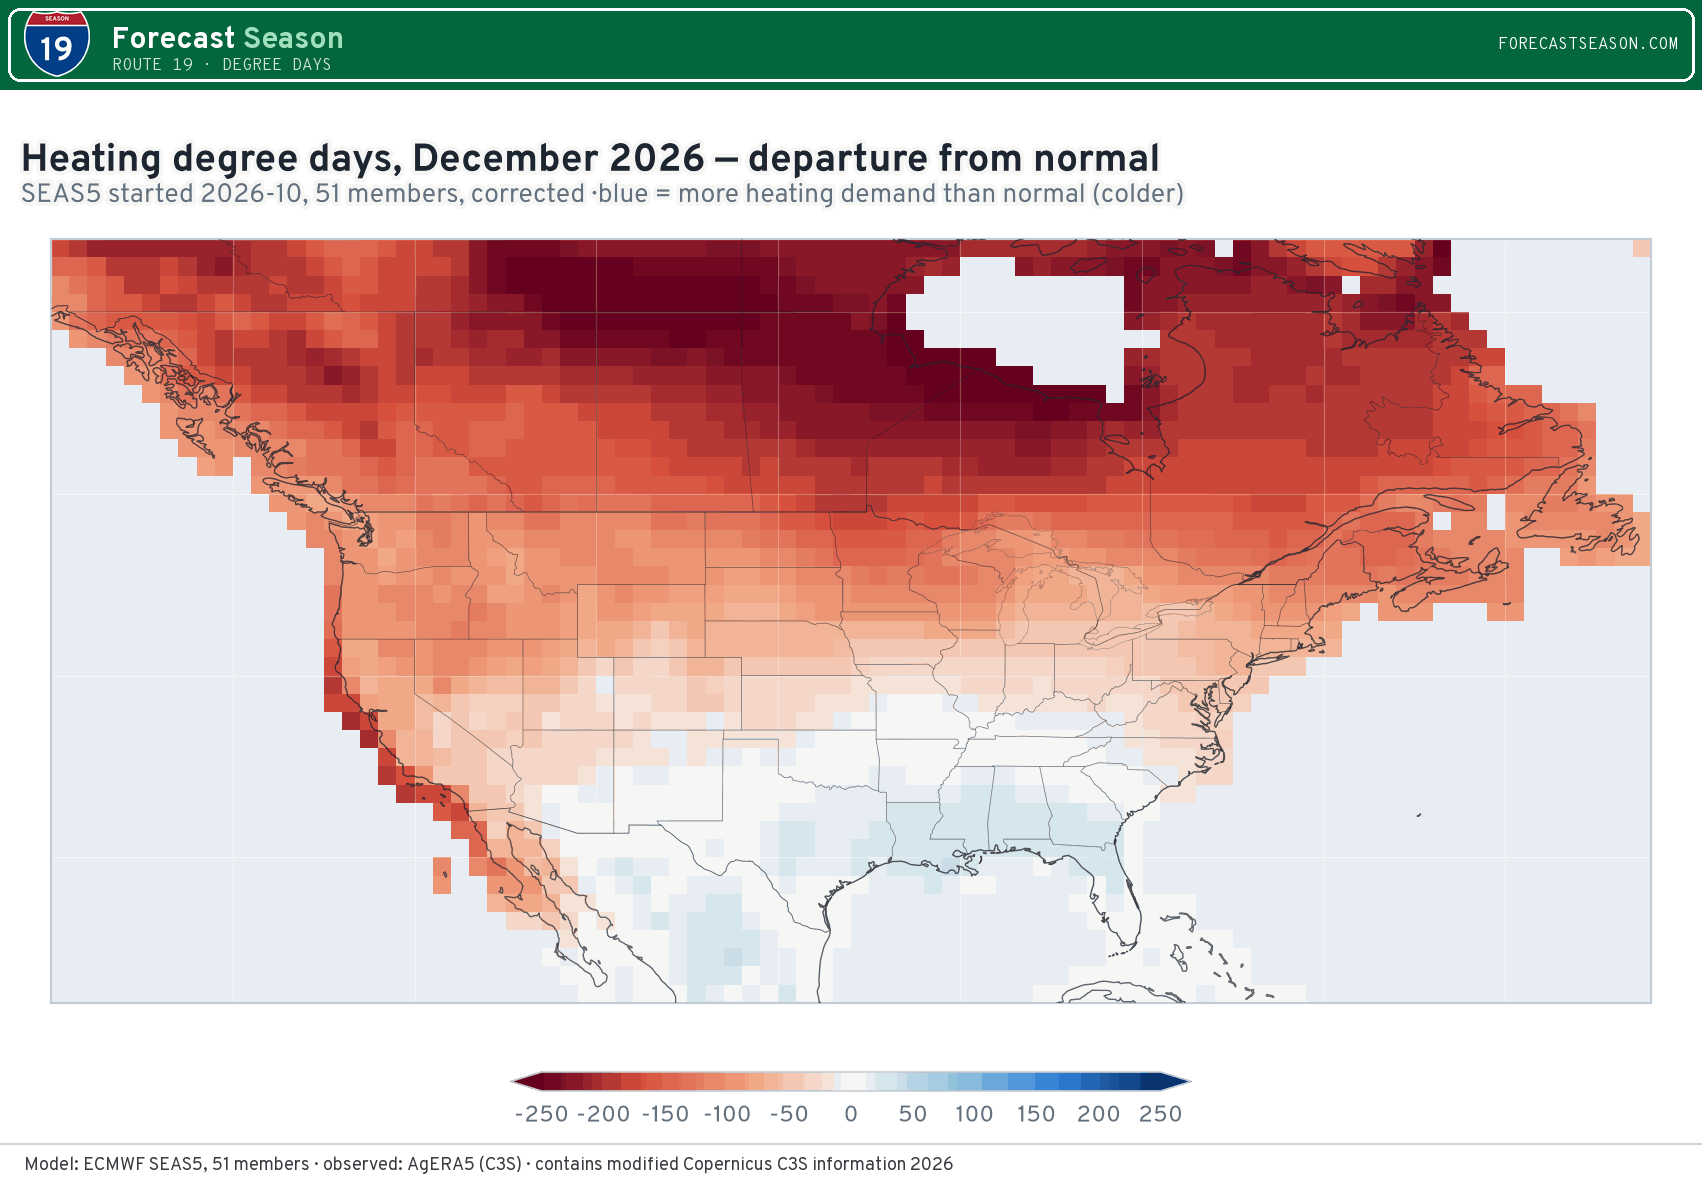
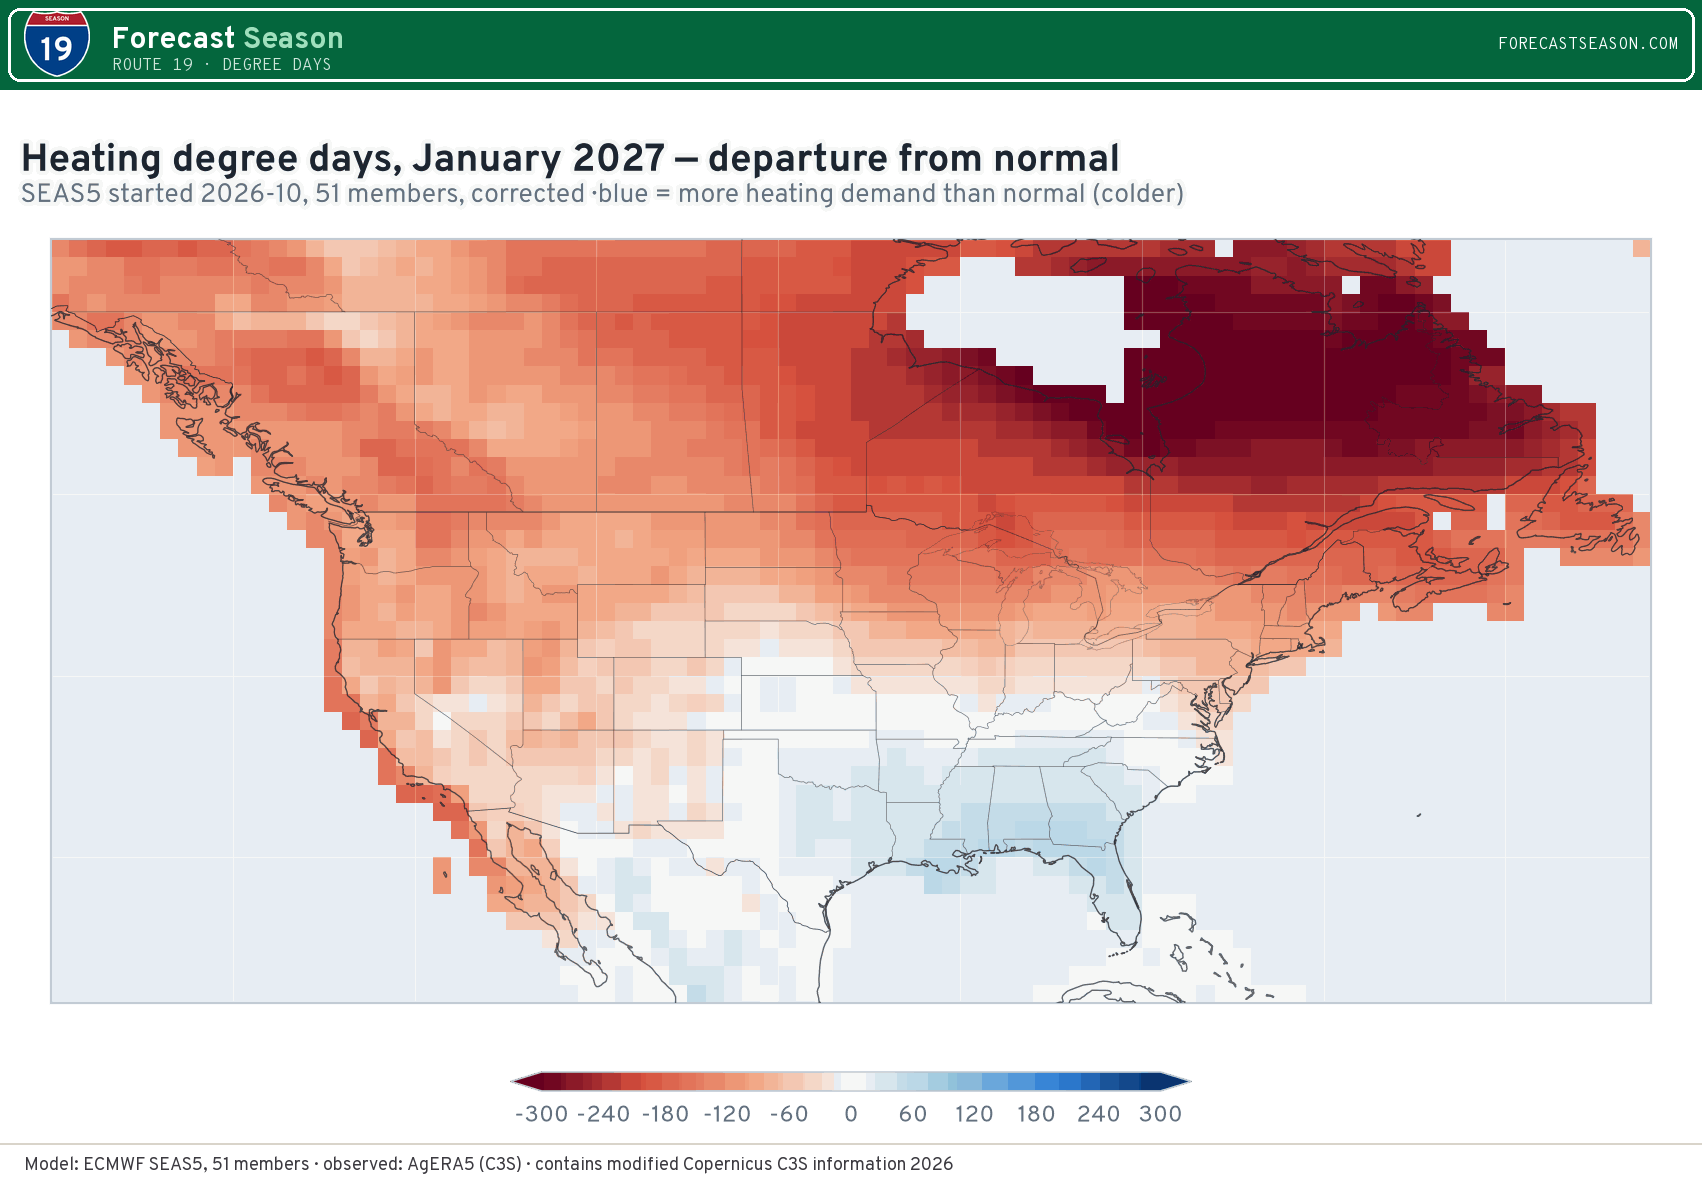
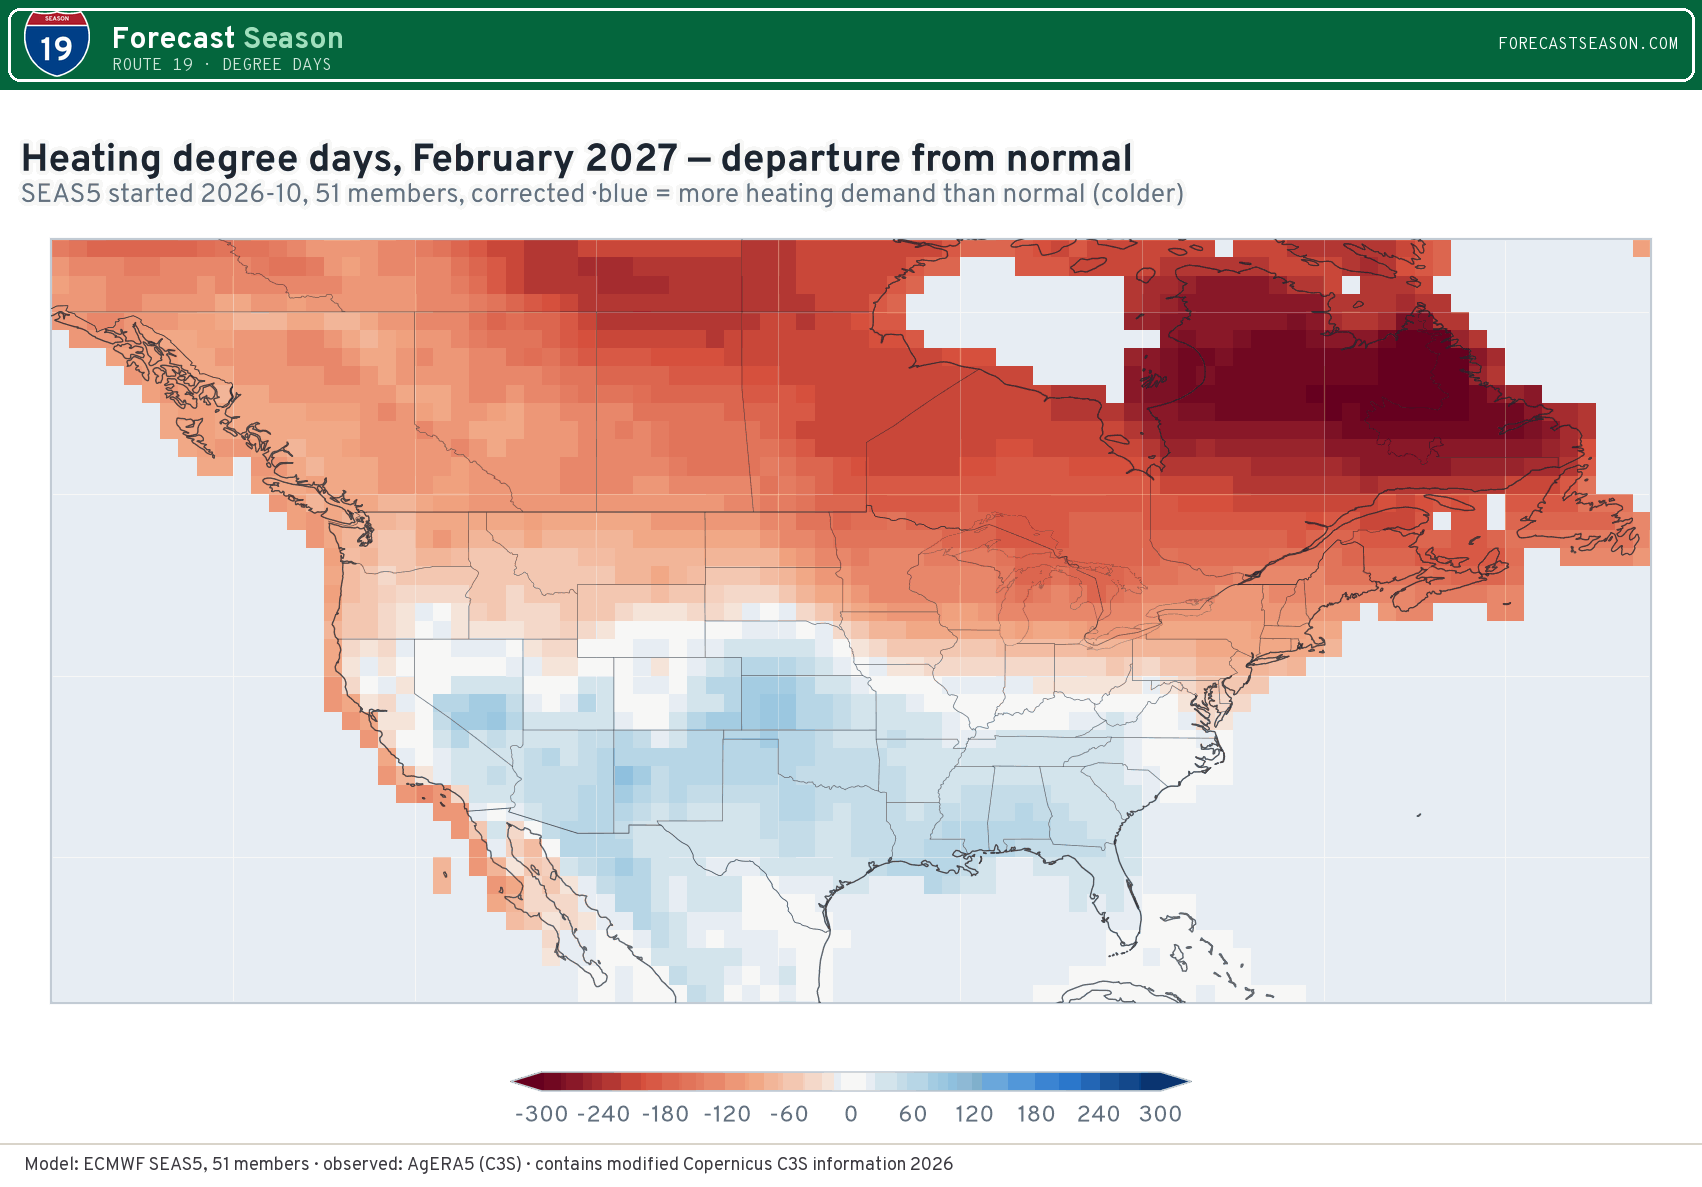
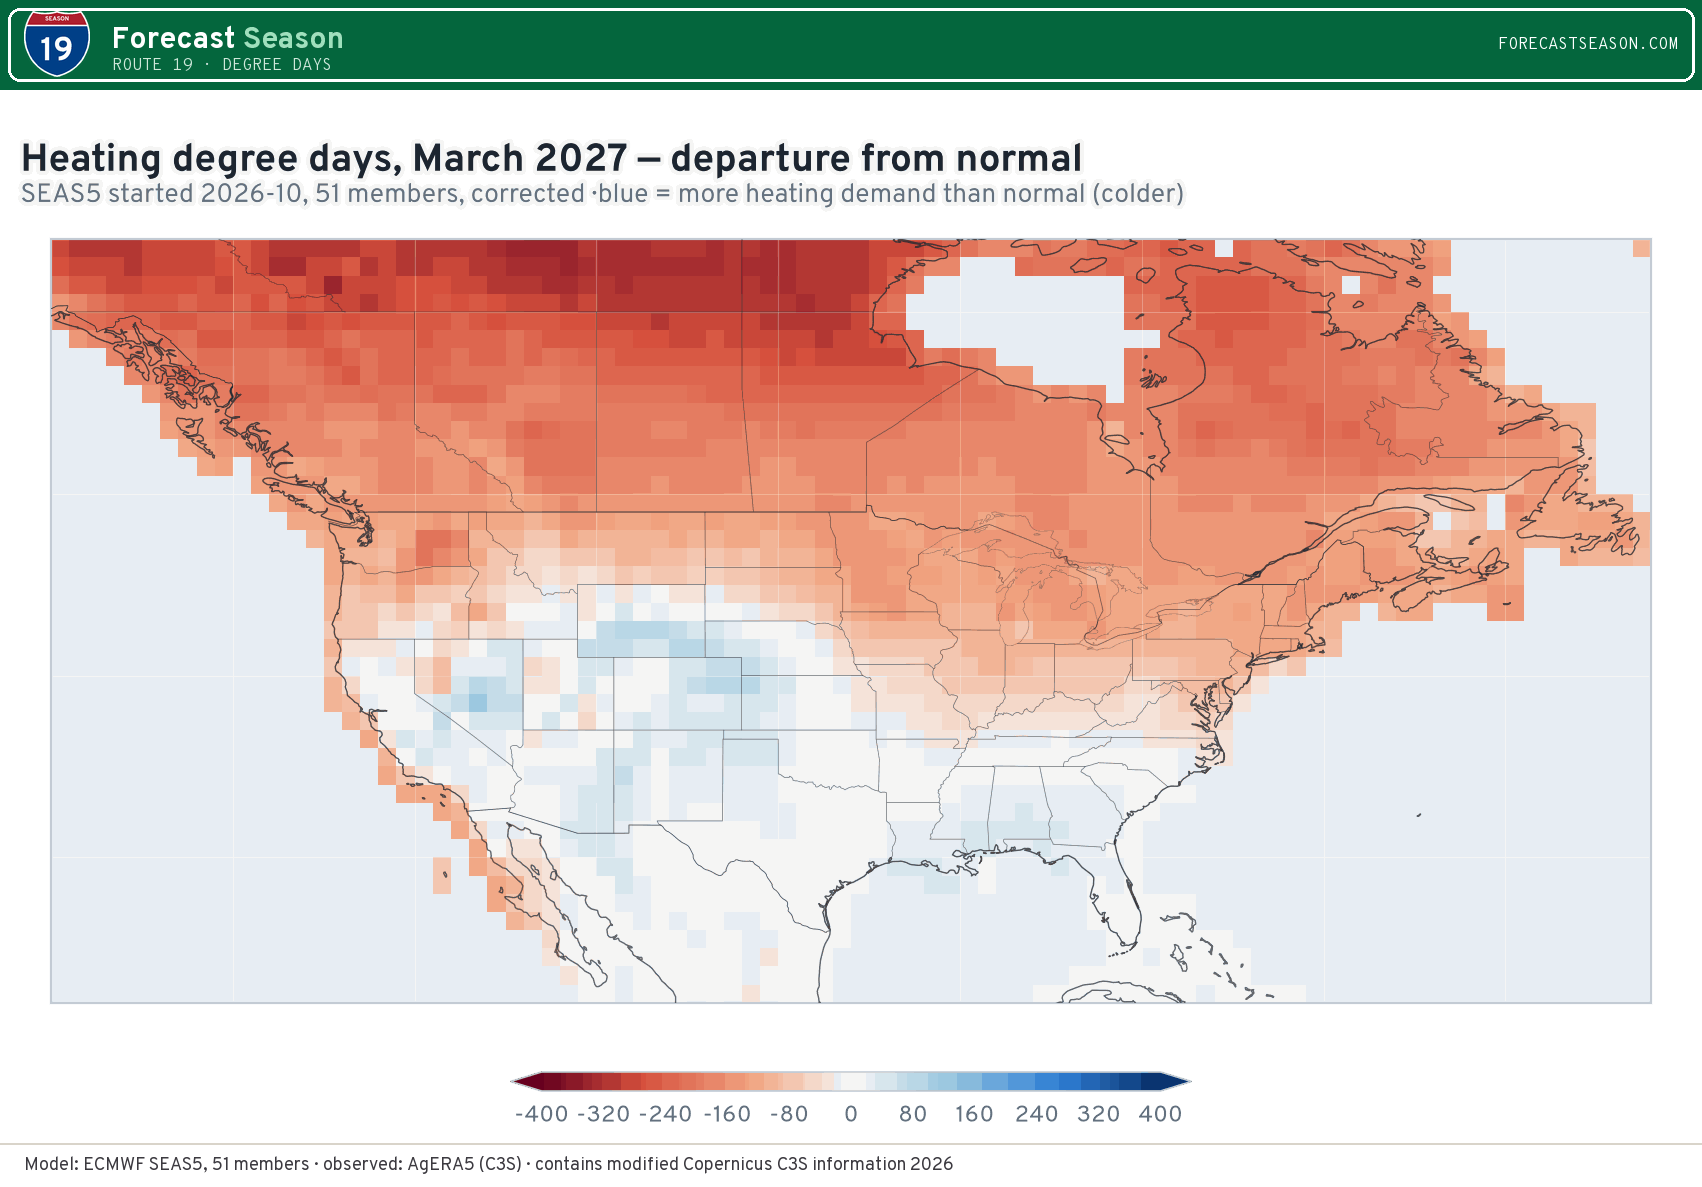
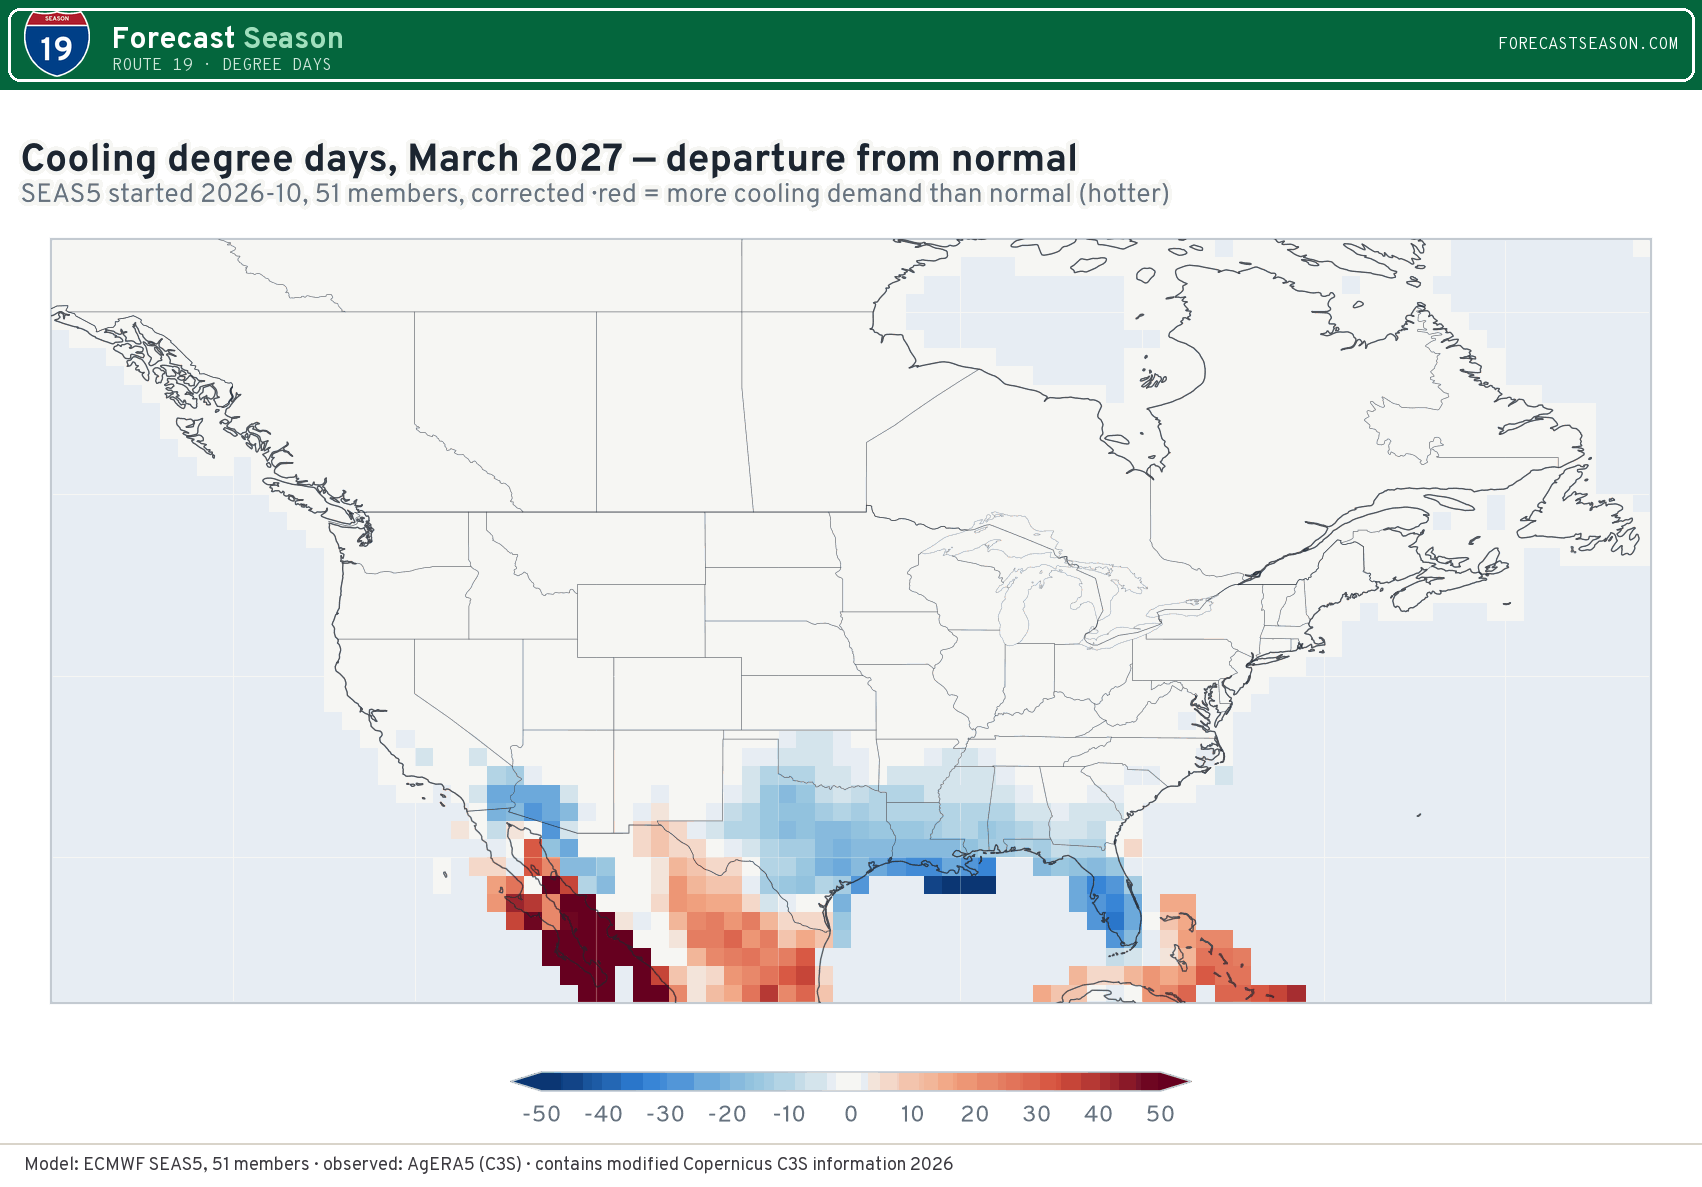
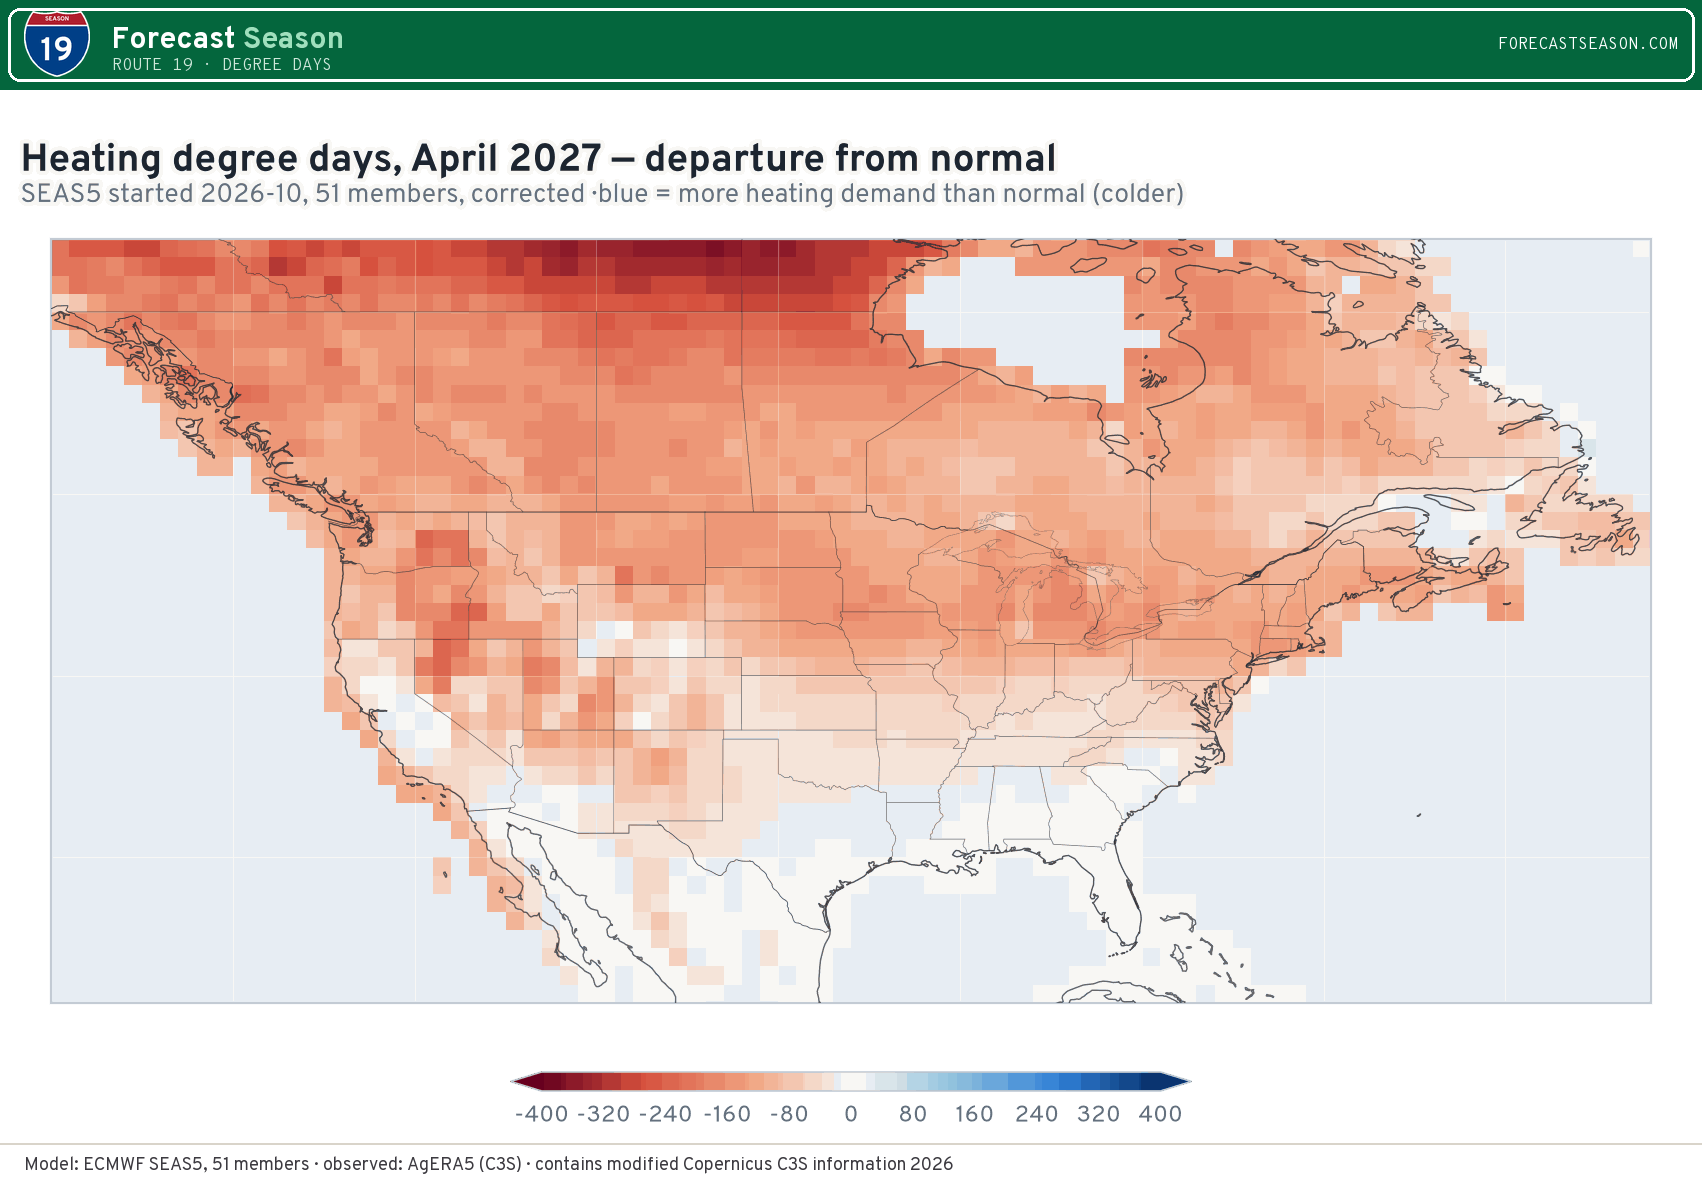
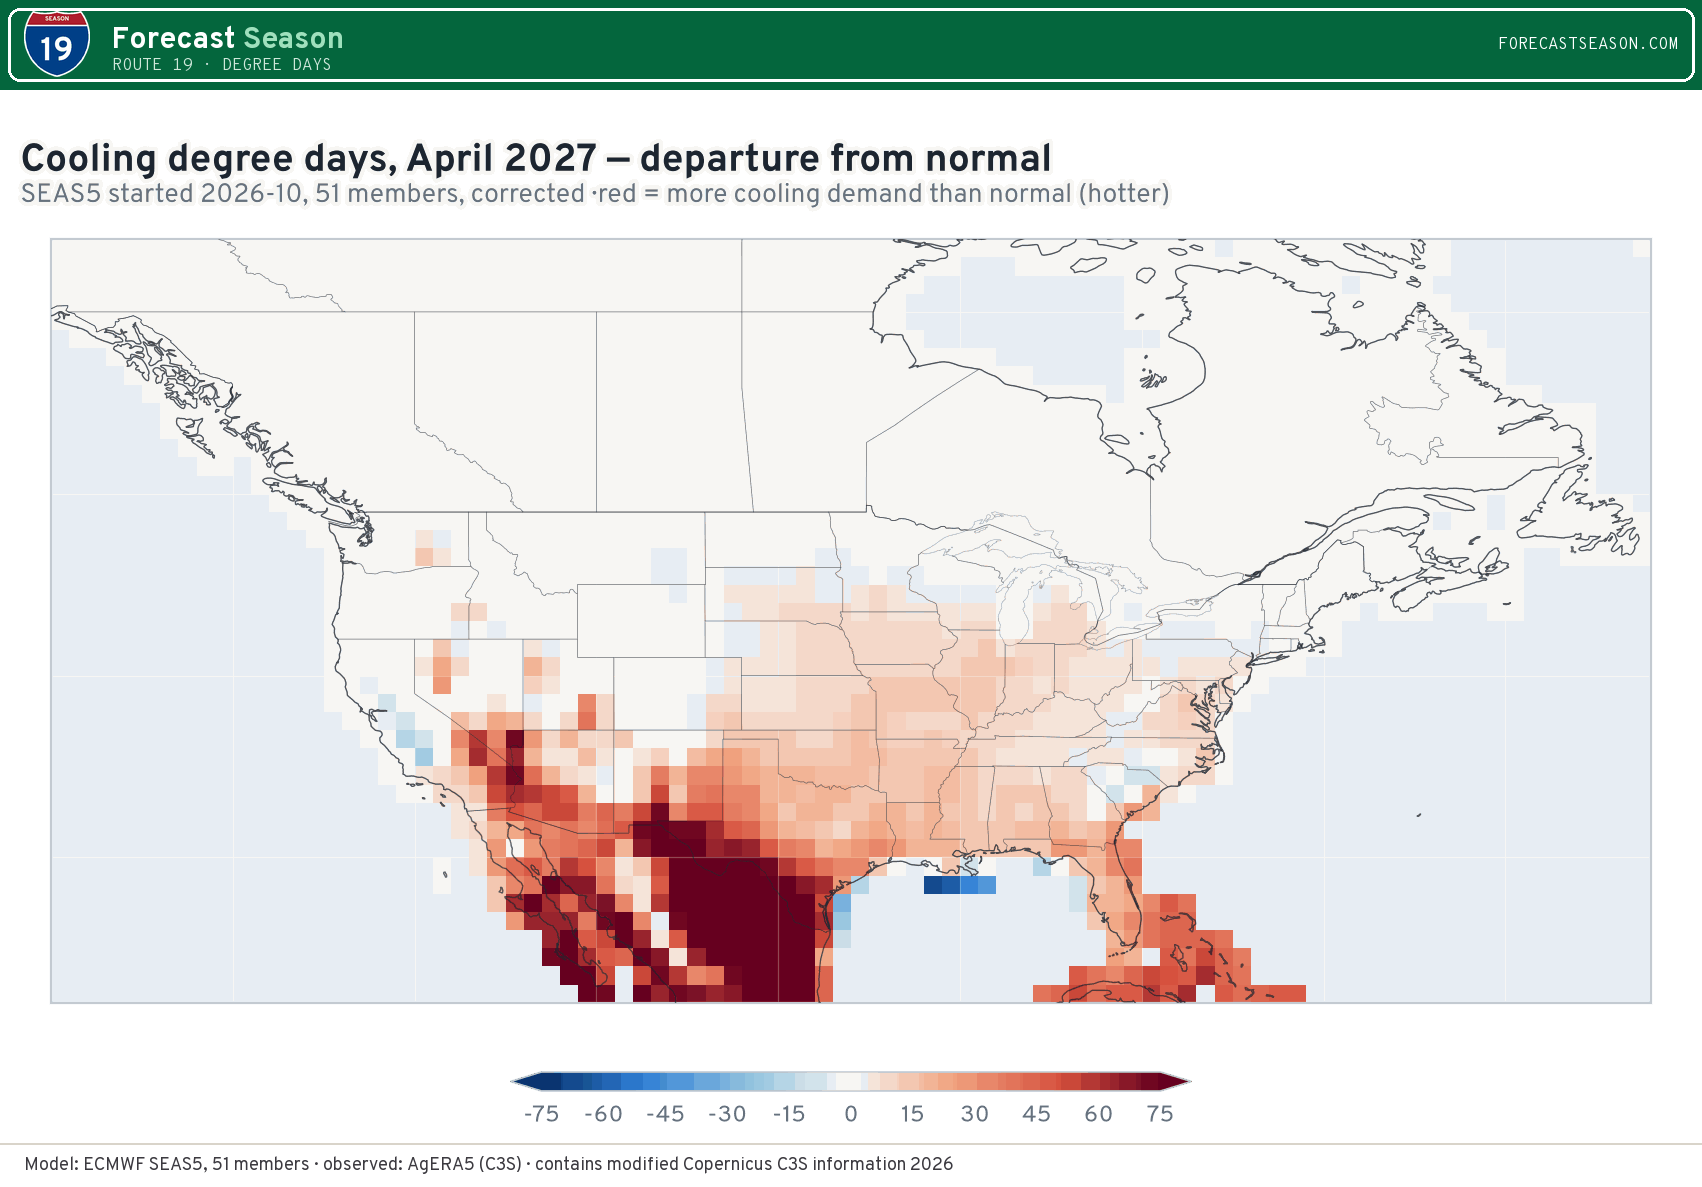
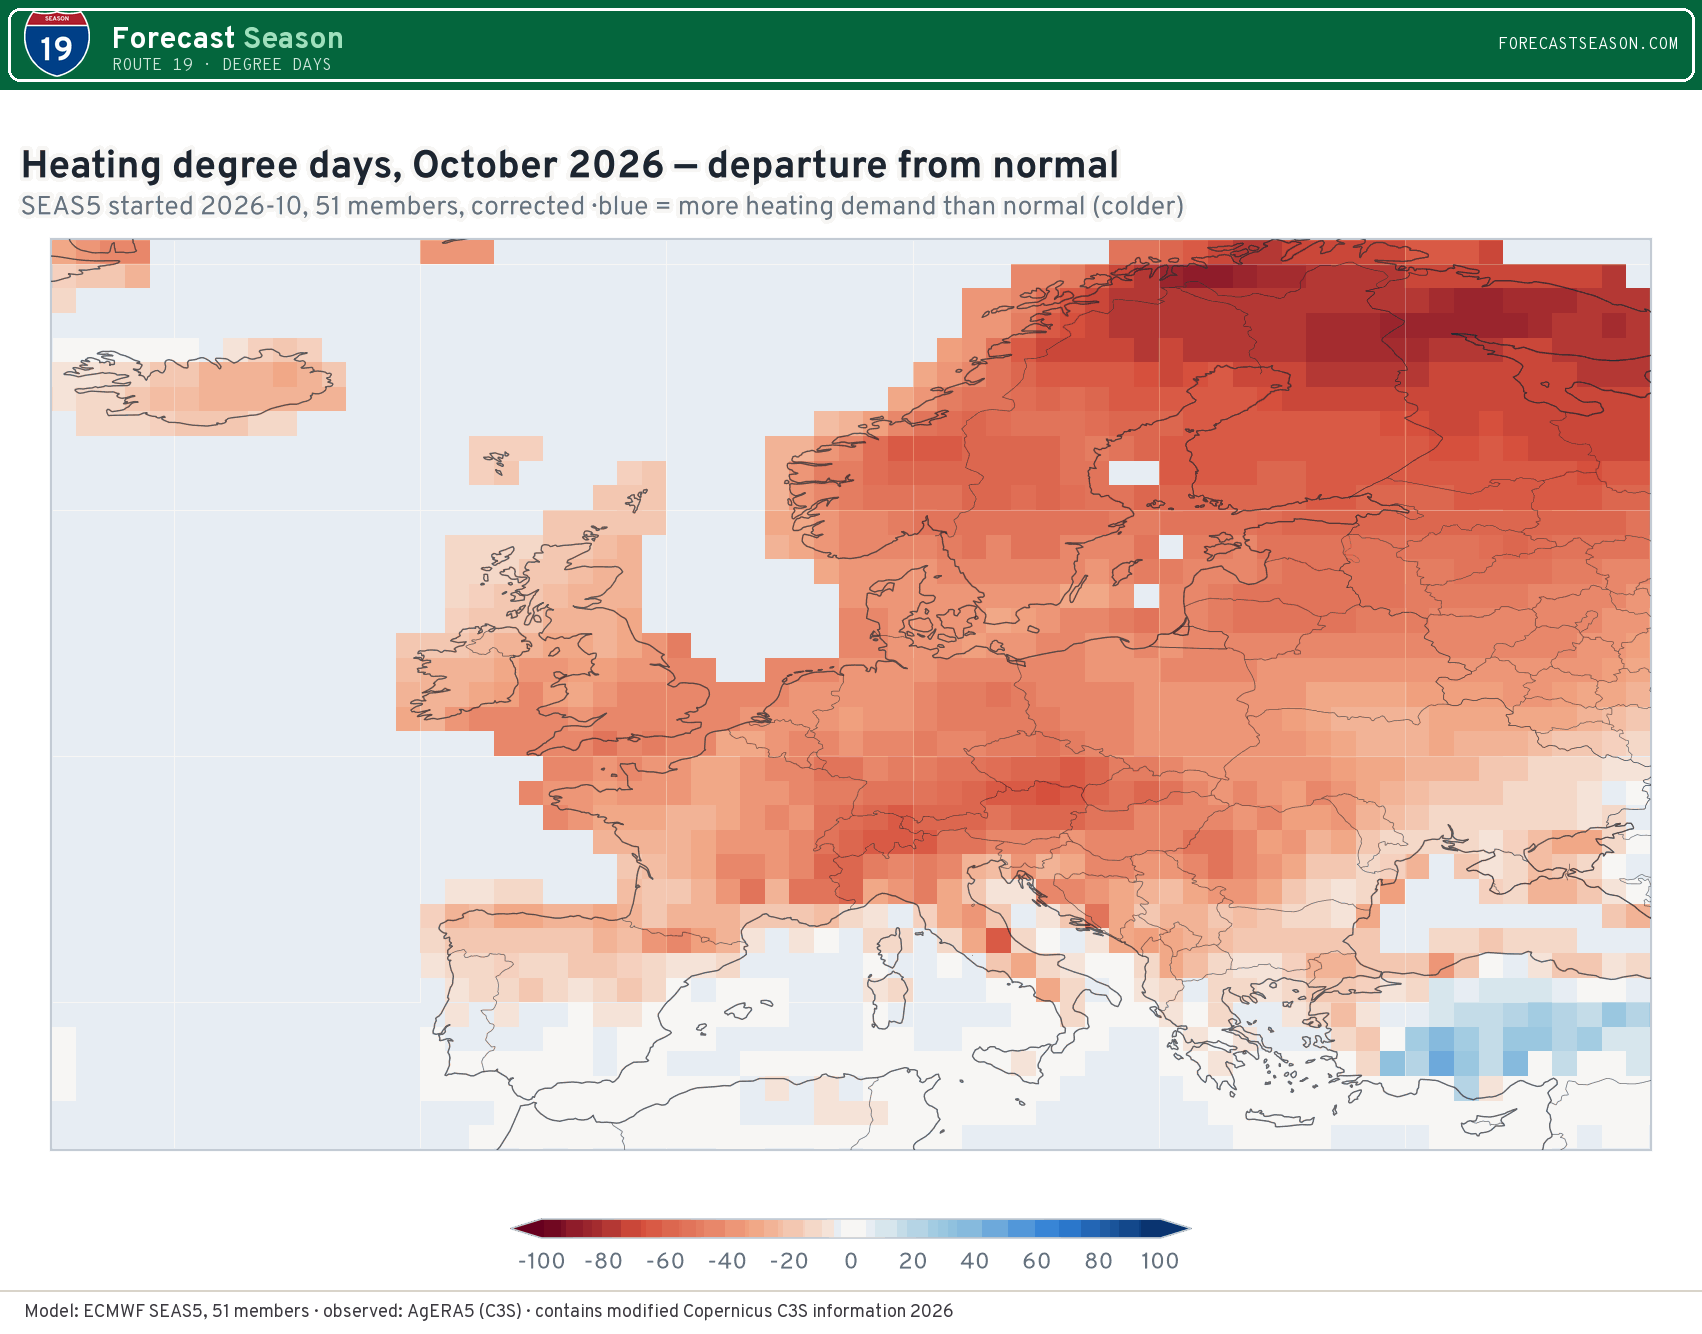
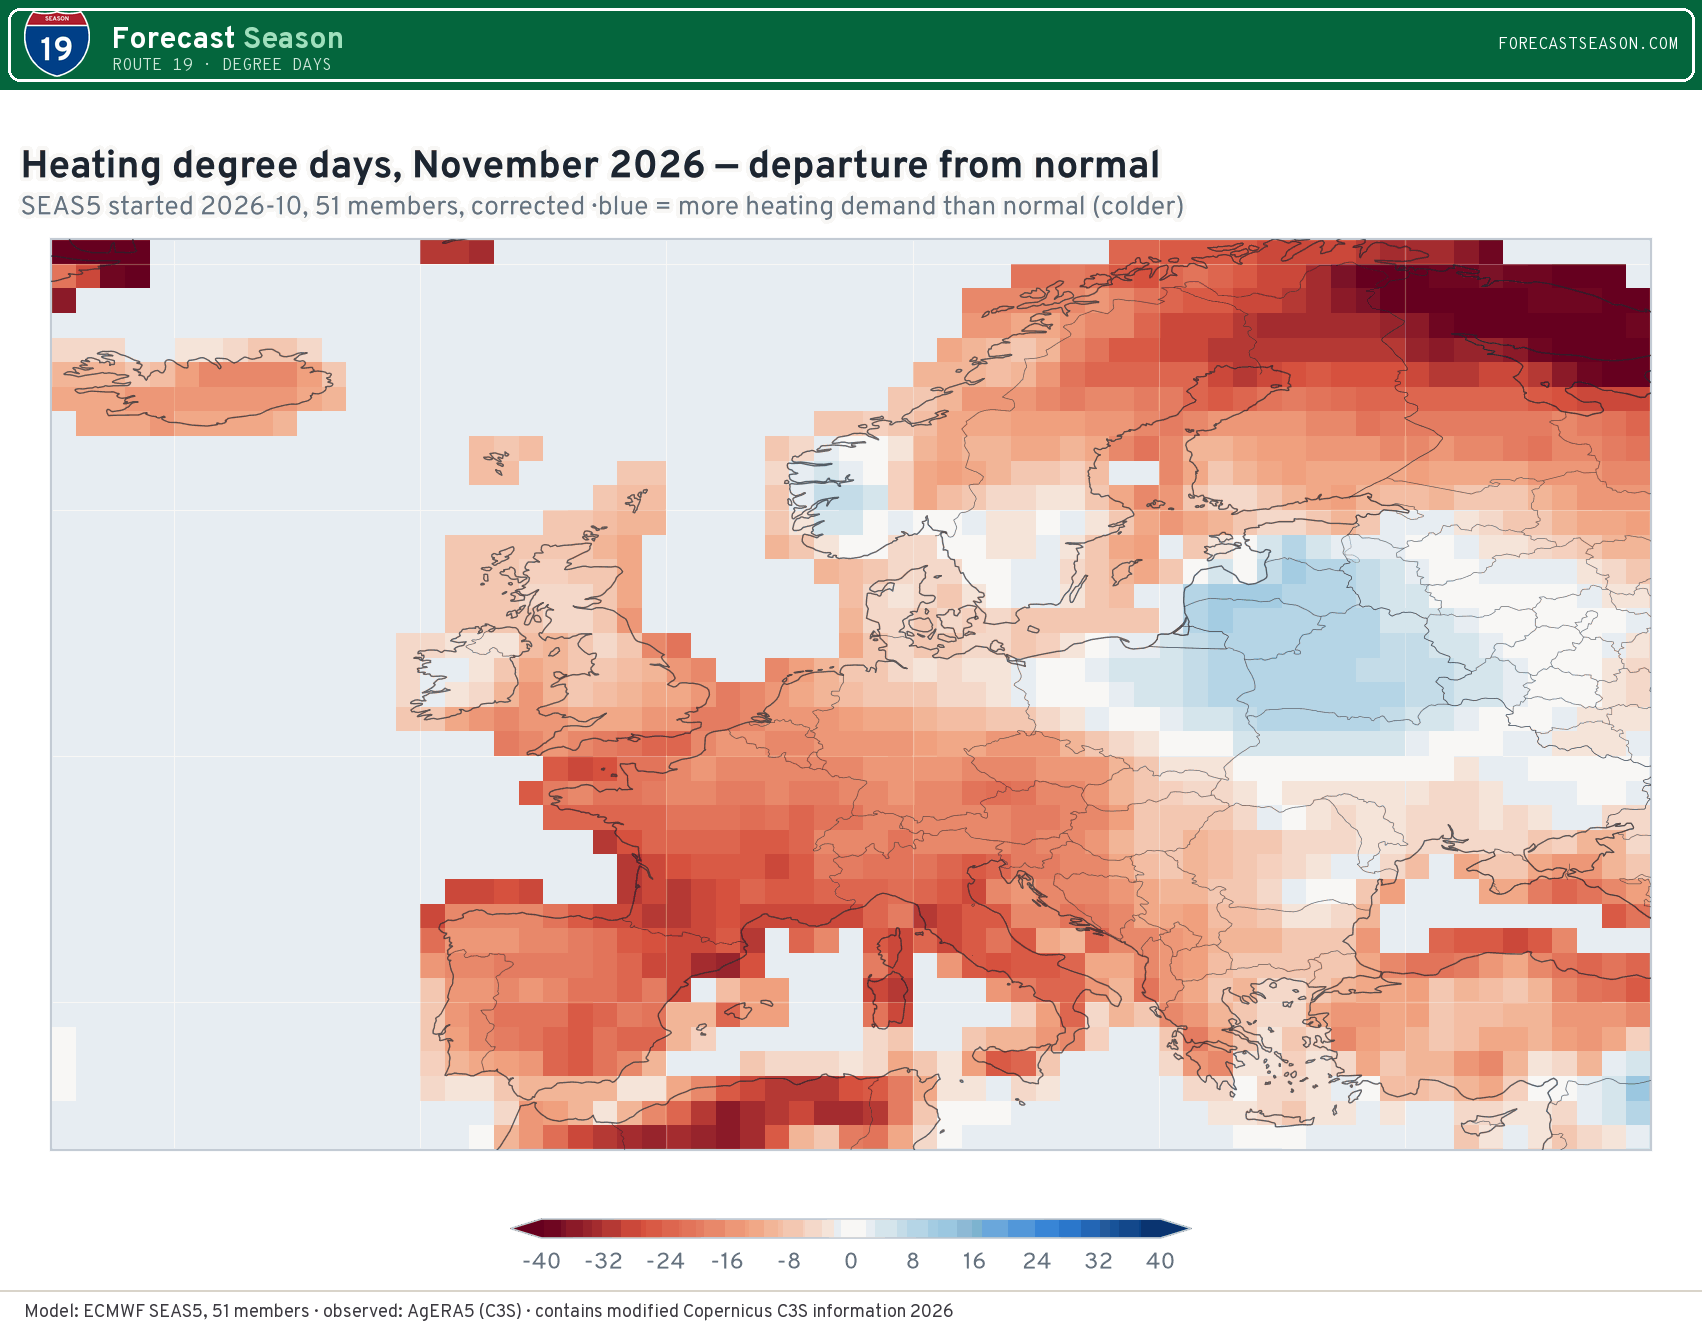
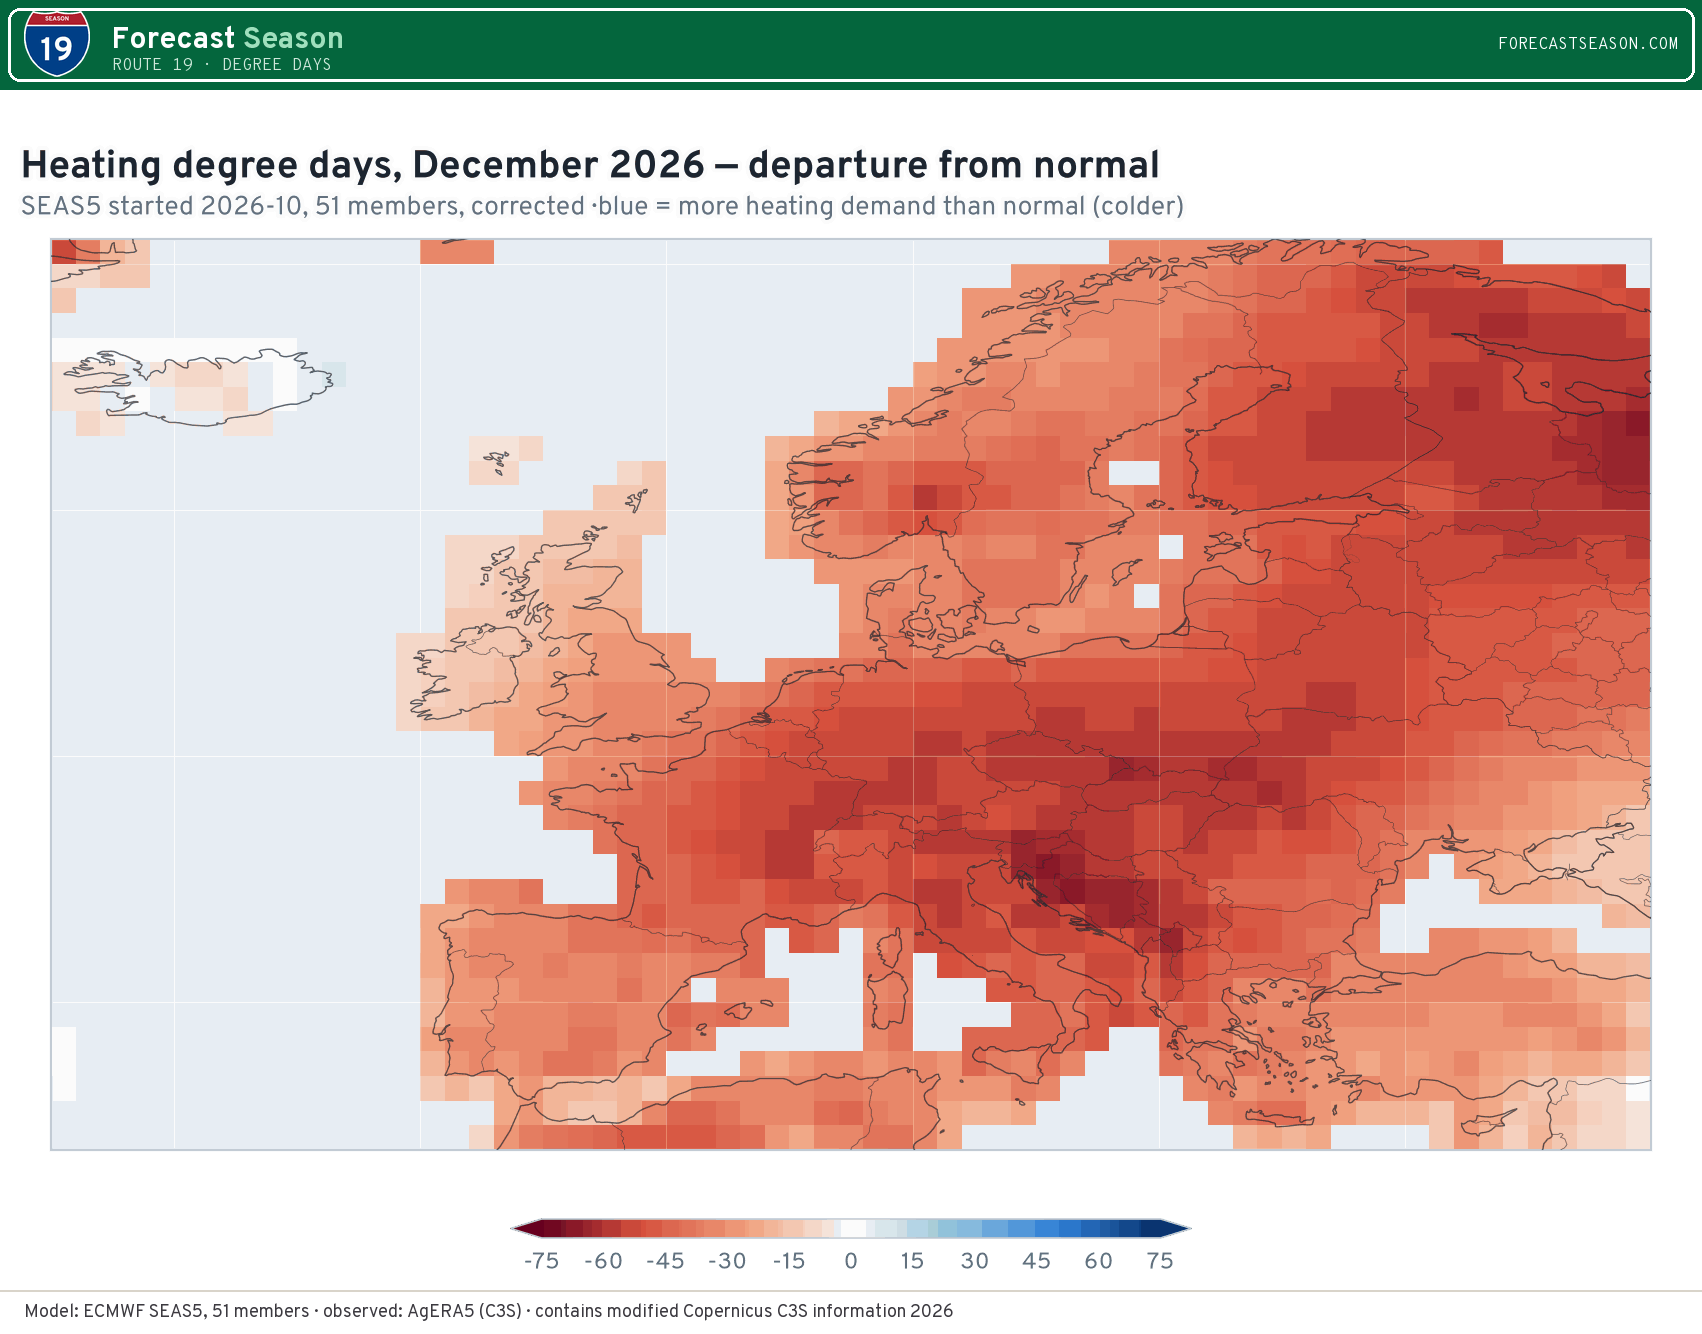
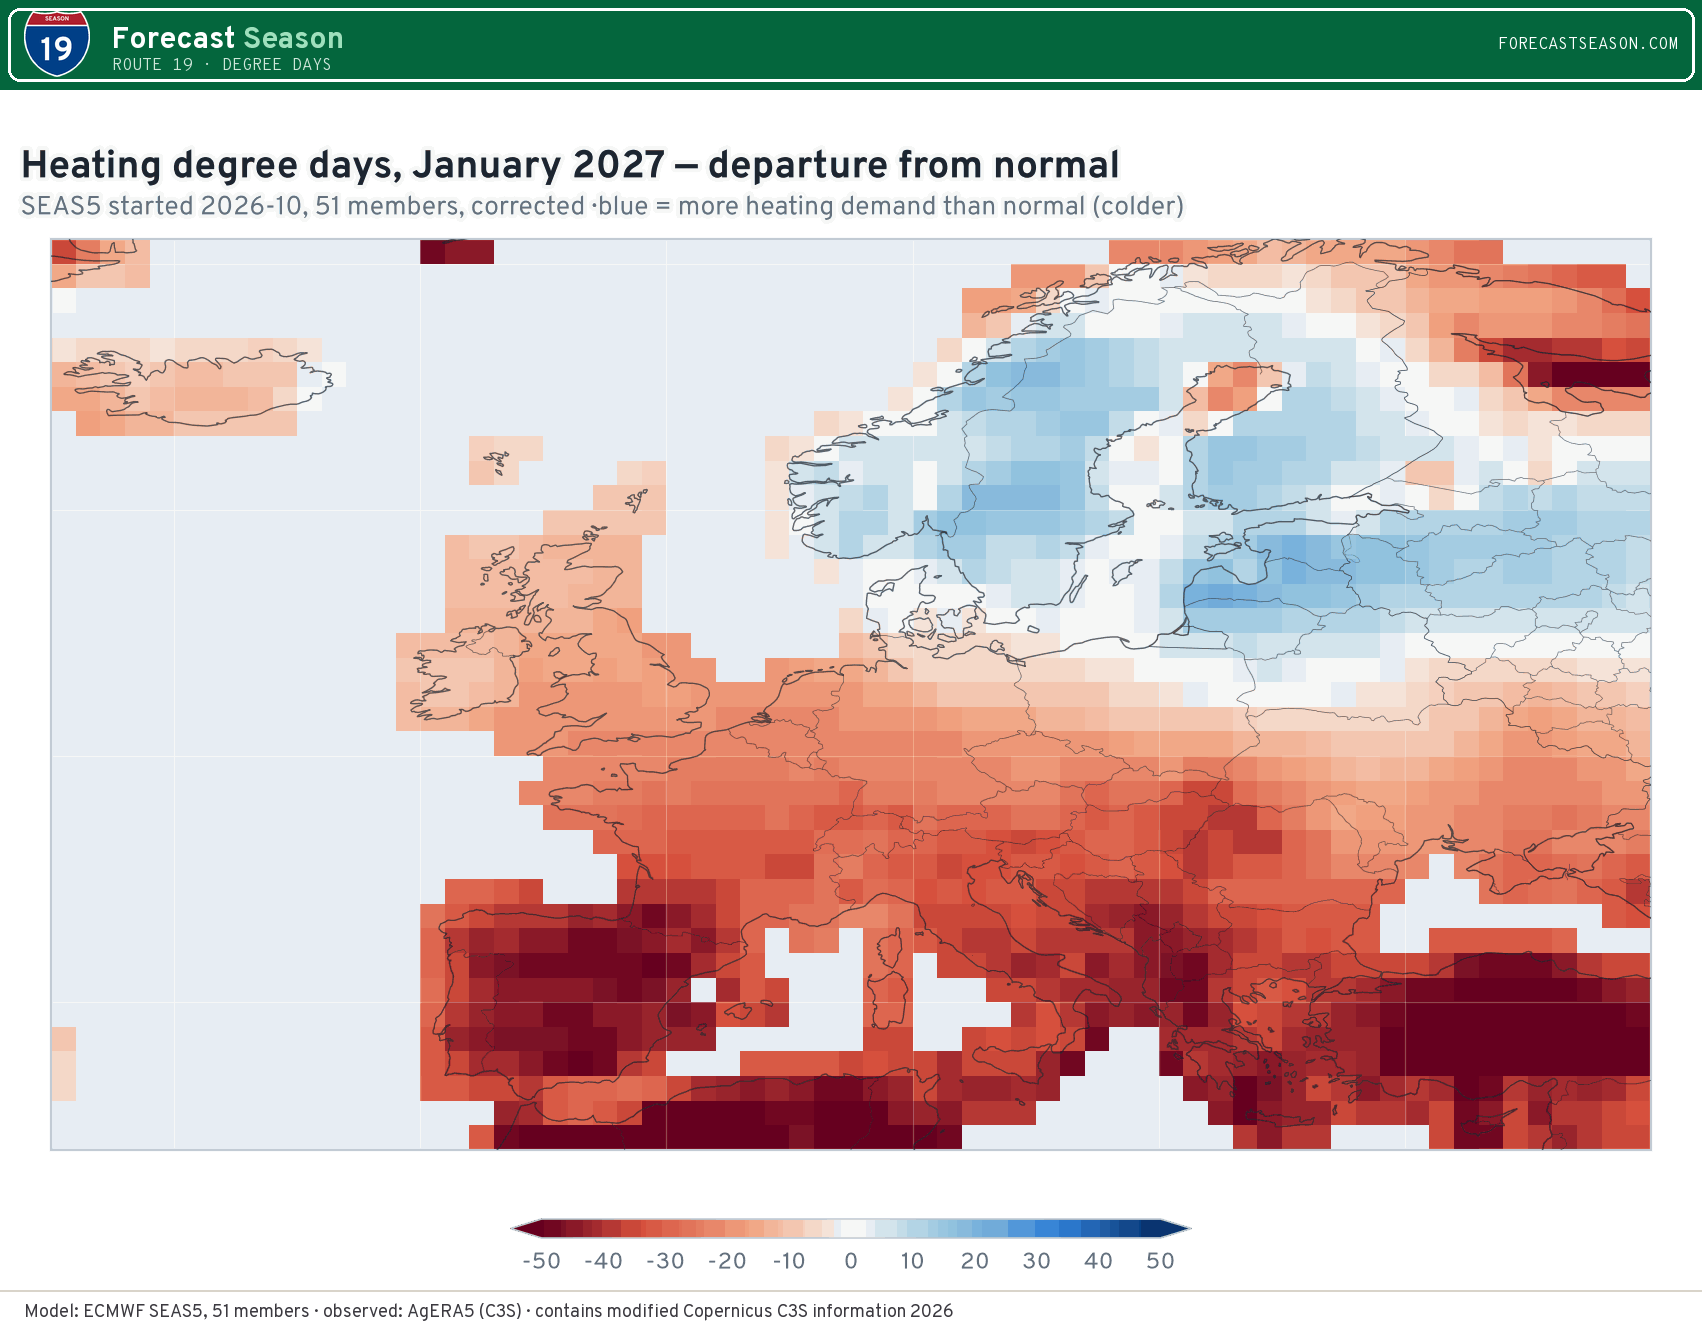
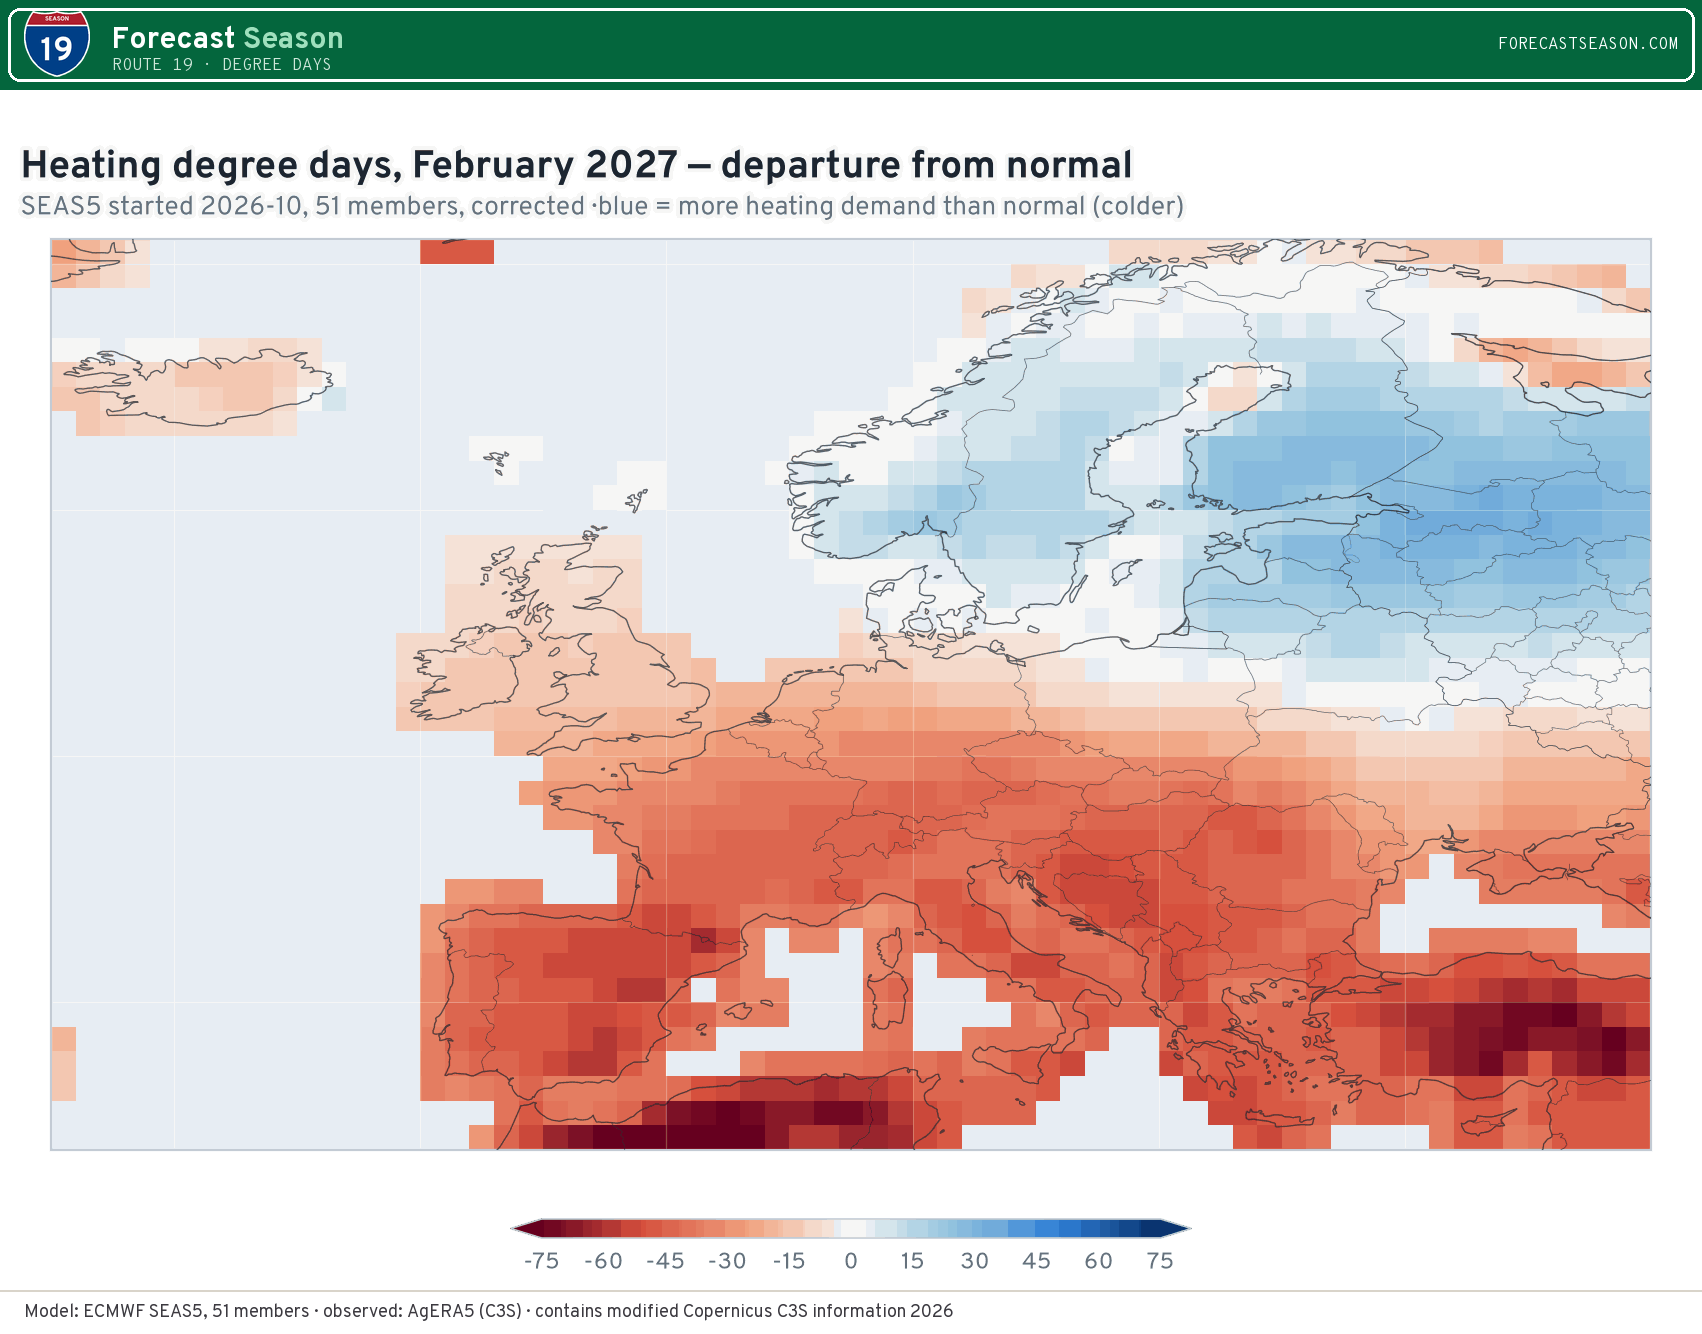
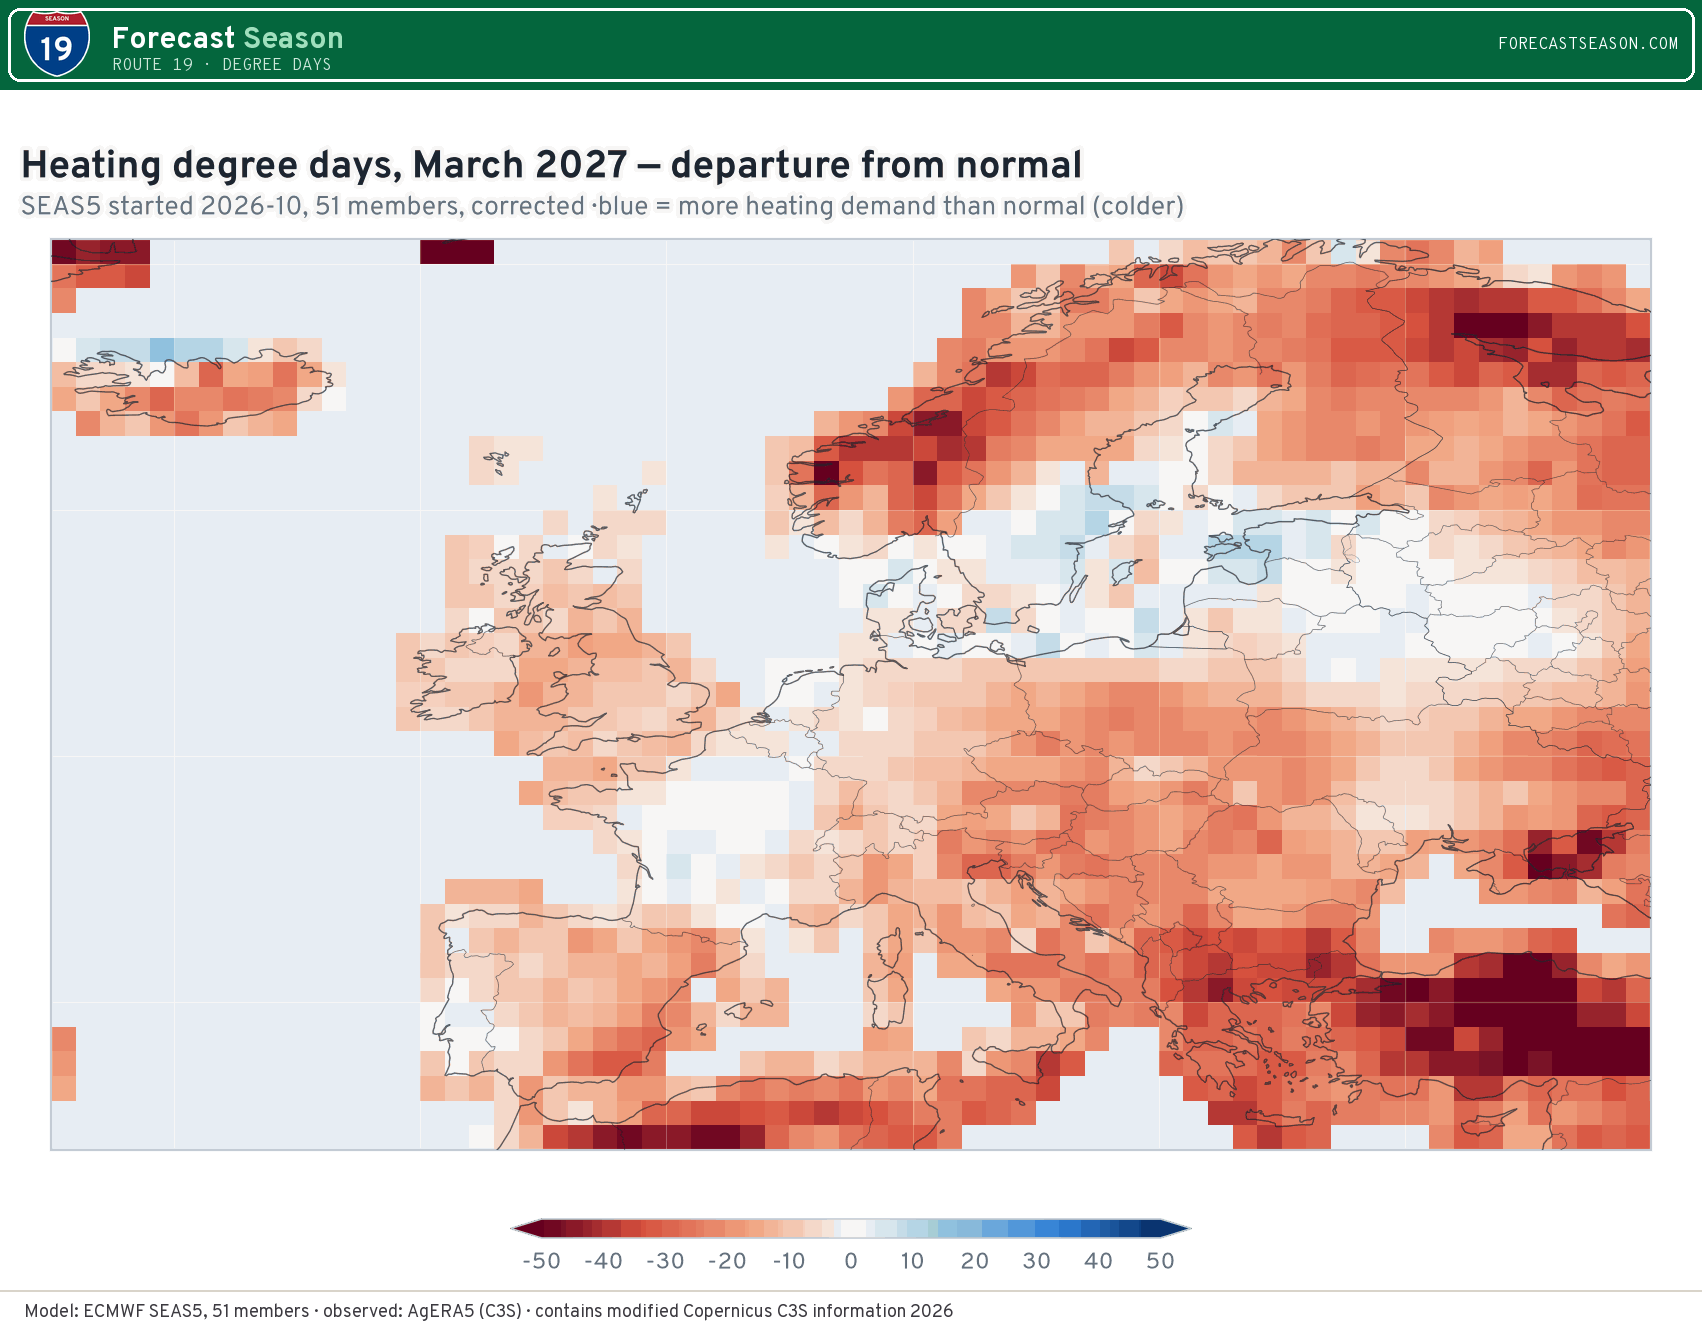
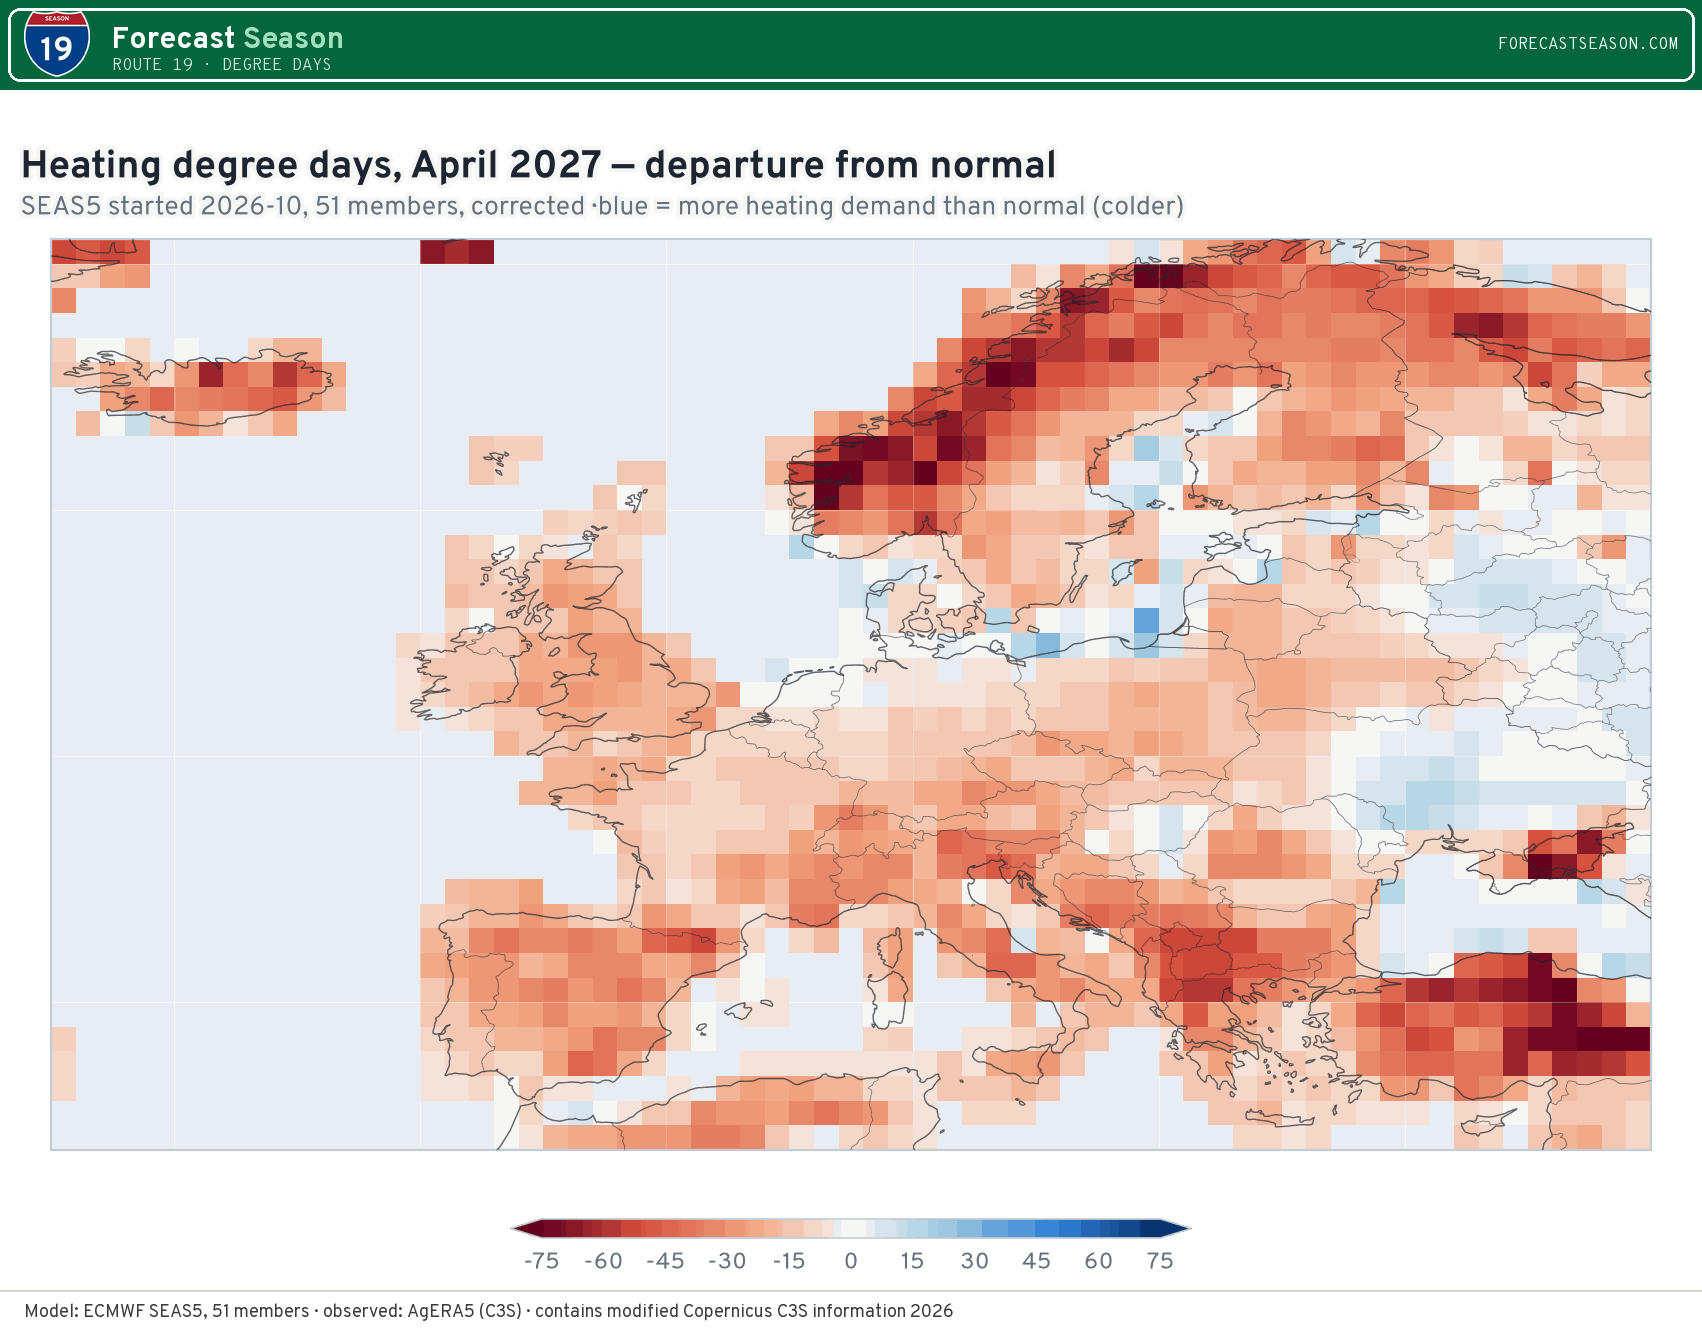
Corrected ensemble-mean degree days minus the 1991–2020 normal. The HDD/CDD control above switches these too; cooling maps are drawn only for months where the normal has cooling demand to speak of.
Cities
the 1° cell each city sits in| Oct 2026 | Nov 2026 | Dec 2026 | Jan 2027 | Feb 2027 | Mar 2027 | Apr 2027 | |
|---|---|---|---|---|---|---|---|
| North America · °F-days | |||||||
| New Yorkcell 40.5°, -74.5° | 291108% | 53094% | 79392% | 94192% | 81391% | 64384% | 29670% |
| Bostoncell 42.5°, -71.5° | 411110% | 64395% | 94193% | 1,09191% | 95292% | 77584% | 40773% |
| Philadelphiacell 39.5°, -75.5° | 240112% | 47795% | 72692% | 86592% | 75993% | 58686% | 25372% |
| Washingtoncell 38.5°, -77.5° | 211105% | 45795% | 70893% | 82093% | 71396% | 51087% | 19773% |
| Atlantacell 33.5°, -84.5° | 7570% | 33596% | 575103% | 673106% | 515106% | 373109% | 11787% |
| Chicagocell 41.5°, -87.5° | 334100% | 67599% | 98795% | 1,11291% | 95893% | 73787% | 37176% |
| Detroitcell 42.5°, -83.5° | 399100% | 729100% | 1,00394% | 1,15592% | 99192% | 78085% | 36568% |
| Minneapoliscell 44.5°, -93.5° | 41385% | 85695% | 1,22592% | 1,36690% | 1,14290% | 84083% | 43475% |
| Dallascell 32.5°, -96.5° | 19 | 231101% | 476104% | 527102% | 423113% | 21396% | 4366% |
| Houstoncell 29.5°, -95.5° | 3 | 116100% | 294111% | 341108% | 254120% | 124110% | 13 |
| Denvercell 39.5°, -104.5° | 28964% | 73295% | 1,02696% | 1,05798% | 968103% | 857107% | 50285% |
| Phoenixcell 33.5°, -112.5° | 0 | 9794% | 30595% | 26390% | 237123% | 98114% | 9 |
| Los Angelescell 34.5°, -118.5° | 2937% | 23082% | 43788% | 42488% | 442106% | 374106% | 20285% |
| San Franciscocell 37.5°, -122.5° | 5636% | 12843% | 24858% | 28764% | 28274% | 30480% | 25877% |
| Seattlecell 47.5°, -122.5° | 33787% | 56594% | 67387% | 66487% | 59589% | 51881% | 36173% |
| Torontocell 43.5°, -79.5° | 404103% | 71099% | 95493% | 1,13892% | 1,00490% | 88388% | 48875% |
| Montréalcell 45.5°, -73.5° | 517104% | 81395% | 1,14690% | 1,38890% | 1,19990% | 1,01289% | 54179% |
| Calgarycell 51.5°, -114.5° | 62180% | 1,07695% | 1,24887% | 1,33691% | 1,12389% | 1,00987% | 66784% |
| Vancouvercell 49.5°, -123.5° | 50592% | 73896% | 81488% | 77584% | 70687% | 65982% | 49376% |
| Europe · °C-days | |||||||
| Londoncell 51.5°, -0.5° | 15076% | 28493% | 36693% | 38093% | 34292% | 33696% | 24892% |
| Pariscell 48.5°, 2.5° | 13182% | 27491% | 35387% | 39292% | 32988% | 31498% | 21396% |
| Berlincell 52.5°, 13.5° | 17675% | 36496% | 45391% | 50094% | 43194% | 38995% | 23193% |
| Amsterdamcell 52.5°, 4.5° | 12674% | 26091% | 34991% | 38793% | 35292% | 35798% | 26398% |
| Madridcell 40.5°, -3.5° | 7887% | 25095% | 34593% | 34486% | 28786% | 272100% | 16389% |
| Romecell 41.5°, 12.5° | 0 | 6772% | 17278% | 22186% | 19081% | 18089% | 8982% |
| Milancell 45.5°, 9.5° | 7963% | 27192% | 39489% | 42090% | 34087% | 27792% | 13480% |
| Warsawcell 52.5°, 21.5° | 23785% | 42199% | 52092% | 57193% | 50495% | 43994% | 25693% |
| Viennacell 48.5°, 16.5° | 14568% | 34493% | 47290% | 50691% | 41590% | 35793% | 19290% |
| Stockholmcell 59.5°, 18.5° | 26984% | 41696% | 50493% | 590101% | 551101% | 52799% | 38094% |
| Oslocell 59.5°, 10.5° | 27483% | 44298% | 52690% | 634101% | 586104% | 49494% | 31484% |
| Oct 2026 | Nov 2026 | Dec 2026 | Jan 2027 | Feb 2027 | Mar 2027 | Apr 2027 | |
|---|---|---|---|---|---|---|---|
| North America · °F-days | |||||||
| New Yorkcell 40.5°, -74.5° | 11 | 0 | 0 | 0 | 0 | 0 | 5 |
| Bostoncell 42.5°, -71.5° | 4 | 0 | 0 | 0 | 0 | 0 | 0 |
| Philadelphiacell 39.5°, -75.5° | 15 | 0 | 0 | 0 | 0 | 0 | 10 |
| Washingtoncell 38.5°, -77.5° | 24 | 0 | 0 | 0 | 0 | 0 | 26 |
| Atlantacell 33.5°, -84.5° | 73118% | 5 | 0 | 0 | 0 | 3 | 41 |
| Chicagocell 41.5°, -87.5° | 2 | 0 | 0 | 0 | 0 | 0 | 3 |
| Detroitcell 42.5°, -83.5° | 3 | 0 | 0 | 0 | 0 | 0 | 4 |
| Minneapoliscell 44.5°, -93.5° | 0 | 0 | 0 | 0 | 0 | 0 | 2 |
| Dallascell 32.5°, -96.5° | 14786% | 24 | 0 | 0 | 0 | 16 | 117115% |
| Houstoncell 29.5°, -95.5° | 279113% | 82103% | 15 | 7 | 10 | 5075% | 191125% |
| Denvercell 39.5°, -104.5° | 1 | 0 | 0 | 0 | 0 | 0 | 0 |
| Phoenixcell 33.5°, -112.5° | 406124% | 48 | 0 | 0 | 0 | 4362% | 249124% |
| Los Angelescell 34.5°, -118.5° | 206288% | 2 | 0 | 0 | 0 | 0 | 16 |
| San Franciscocell 37.5°, -122.5° | 28 | 2 | 0 | 0 | 0 | 0 | 0 |
| Seattlecell 47.5°, -122.5° | 0 | 0 | 0 | 0 | 0 | 0 | 0 |
| Torontocell 43.5°, -79.5° | 0 | 0 | 0 | 0 | 0 | 0 | 0 |
| Montréalcell 45.5°, -73.5° | 0 | 0 | 0 | 0 | 0 | 0 | 0 |
| Calgarycell 51.5°, -114.5° | 0 | 0 | 0 | 0 | 0 | 0 | 0 |
| Vancouvercell 49.5°, -123.5° | 0 | 0 | 0 | 0 | 0 | 0 | 0 |
| Europe · °C-days | |||||||
| Londoncell 51.5°, -0.5° | 0 | 0 | 0 | 0 | 0 | 0 | 0 |
| Pariscell 48.5°, 2.5° | 0 | 0 | 0 | 0 | 0 | 0 | 0 |
| Berlincell 52.5°, 13.5° | 0 | 0 | 0 | 0 | 0 | 0 | 0 |
| Amsterdamcell 52.5°, 4.5° | 0 | 0 | 0 | 0 | 0 | 0 | 0 |
| Madridcell 40.5°, -3.5° | 0 | 0 | 0 | 0 | 0 | 0 | 0 |
| Romecell 41.5°, 12.5° | 0 | 0 | 0 | 0 | 0 | 0 | 0 |
| Milancell 45.5°, 9.5° | 0 | 0 | 0 | 0 | 0 | 0 | 0 |
| Warsawcell 52.5°, 21.5° | 0 | 0 | 0 | 0 | 0 | 0 | 0 |
| Viennacell 48.5°, 16.5° | 0 | 0 | 0 | 0 | 0 | 0 | 0 |
| Stockholmcell 59.5°, 18.5° | 0 | 0 | 0 | 0 | 0 | 0 | 0 |
| Oslocell 59.5°, 10.5° | 0 | 0 | 0 | 0 | 0 | 0 | 0 |
Corrected median for the month, with its share of normal. A 1° cell is about 100 km across, so these are the city's surroundings, not its airport; the normal is taken on the same cell, so the comparison is fair.
Last winter, checked
three 2025 runs against AgERA5Pick a 2025 run in the Run control above and the chart shows it against what happened. The summary, population-weighted heating degree days, every month each run covered:
| Typical miss, raw | Bias, raw | Typical miss, corrected | Bias, corrected | Observed inside 10–90% of members | Correction | |
|---|---|---|---|---|---|---|
| United States (lower 48)18 run-months | 11% | +2% | 6% | 0% | 94% | ✓ better |
| Canada23 run-months | 9% | −4% | 9% | +1% | 83% | ✓ better |
| Europe (EU, UK, Norway, Switzerland)22 run-months | 13% | +10% | 10% | +5% | 100% | ✓ better |
| Germany22 run-months | 12% | +7% | 10% | +4% | 100% | ✓ better |
| France20 run-months | 18% | +10% | 13% | +4% | 85% | ✓ better |
| United Kingdom22 run-months | 18% | +12% | 14% | +6% | 91% | ✓ better |
| Italy20 run-months | 19% | +19% | 12% | +3% | 80% | ✓ better |
| Poland22 run-months | 10% | 0% | 12% | −2% | 91% | ✗ worse |
Typical miss: the mean absolute difference between the members' median and AgERA5, as a share of AgERA5, over every month with real heating demand. Bias: the same with the sign kept, so positive is a forecast that was too cold. April is past the monthly reforecast's six months and borrows February's correction; February is past the monthly reforecast's six months and borrows January's correction; March is past the monthly reforecast's six months and borrows February's correction; the October 2025 run has no reforecast of its own and uses the September start's; the October 2026 run has no reforecast of its own and uses the September start's.
How it is made
six things to knowConventions
Each continent's own
North America in °F-days against 65 °F, as NOAA and the US gas and power markets count them. Europe in °C-days by Eurostat's rule: heating is 18 °C minus the daily mean when the mean is 15 °C or below; cooling is the mean minus 21 °C when it is 24 °C or above. The daily mean is (Tmax + Tmin) / 2 on both sides.
Order of operations
Days first, members kept apart
Each member's every day becomes a degree day before anything is averaged or summed. A degree day is not linear in temperature, so the degree days of an average temperature are not the average of the degree days — a mild ensemble mean hides the cold members that make the bill.
Correction
Anchored to the observed record
SEAS5 has no daily Tmax/Tmin reforecast on file, so each calendar month and 1° cell is shifted by the model's 1993–2016 mean temperature (from its monthly reforecast, plus its own gap between the max/min midpoint and the daily mean) minus AgERA5's over the same years. The forecast's anomaly — including any warming — is kept.
Observed
AgERA5, on the same grid
Copernicus' AgERA5: daily day-time maximum and night-time minimum, local days, 0.1° land averaged into each SEAS5 1° cell. SEAS5's days are UTC days; summing by month absorbs most of that difference, which is why nothing here is published at a daily step.
Weighting
People or area
Population weights are GHS-POP 2025 counts; regions are Natural Earth countries and, for the US census divisions, states. Area weighting treats every square kilometre alike — what a climatologist would average, where population weighting is what a utility pays.
Where next
The temperature behind it
The monthly temperature outlook these numbers rest on is on the Probability Plate; individual members day by day on the Daily Forecast; and the other systems' view on Multi-model.