The Probability Plate
Route 01 shows what the ensemble mean thinks. This shows what the fifty-one members think, which is the only honest form for a seasonal forecast: the answer to how warm will October be is a distribution, not a number. Every panel is scored against the model's own 24-year reforecast, and stippled where issuing it would be worse than saying nothing.
Members
Hindcast
Trend shift
Rainfall RPSS
The plate
8 layers · 7 views · 6 months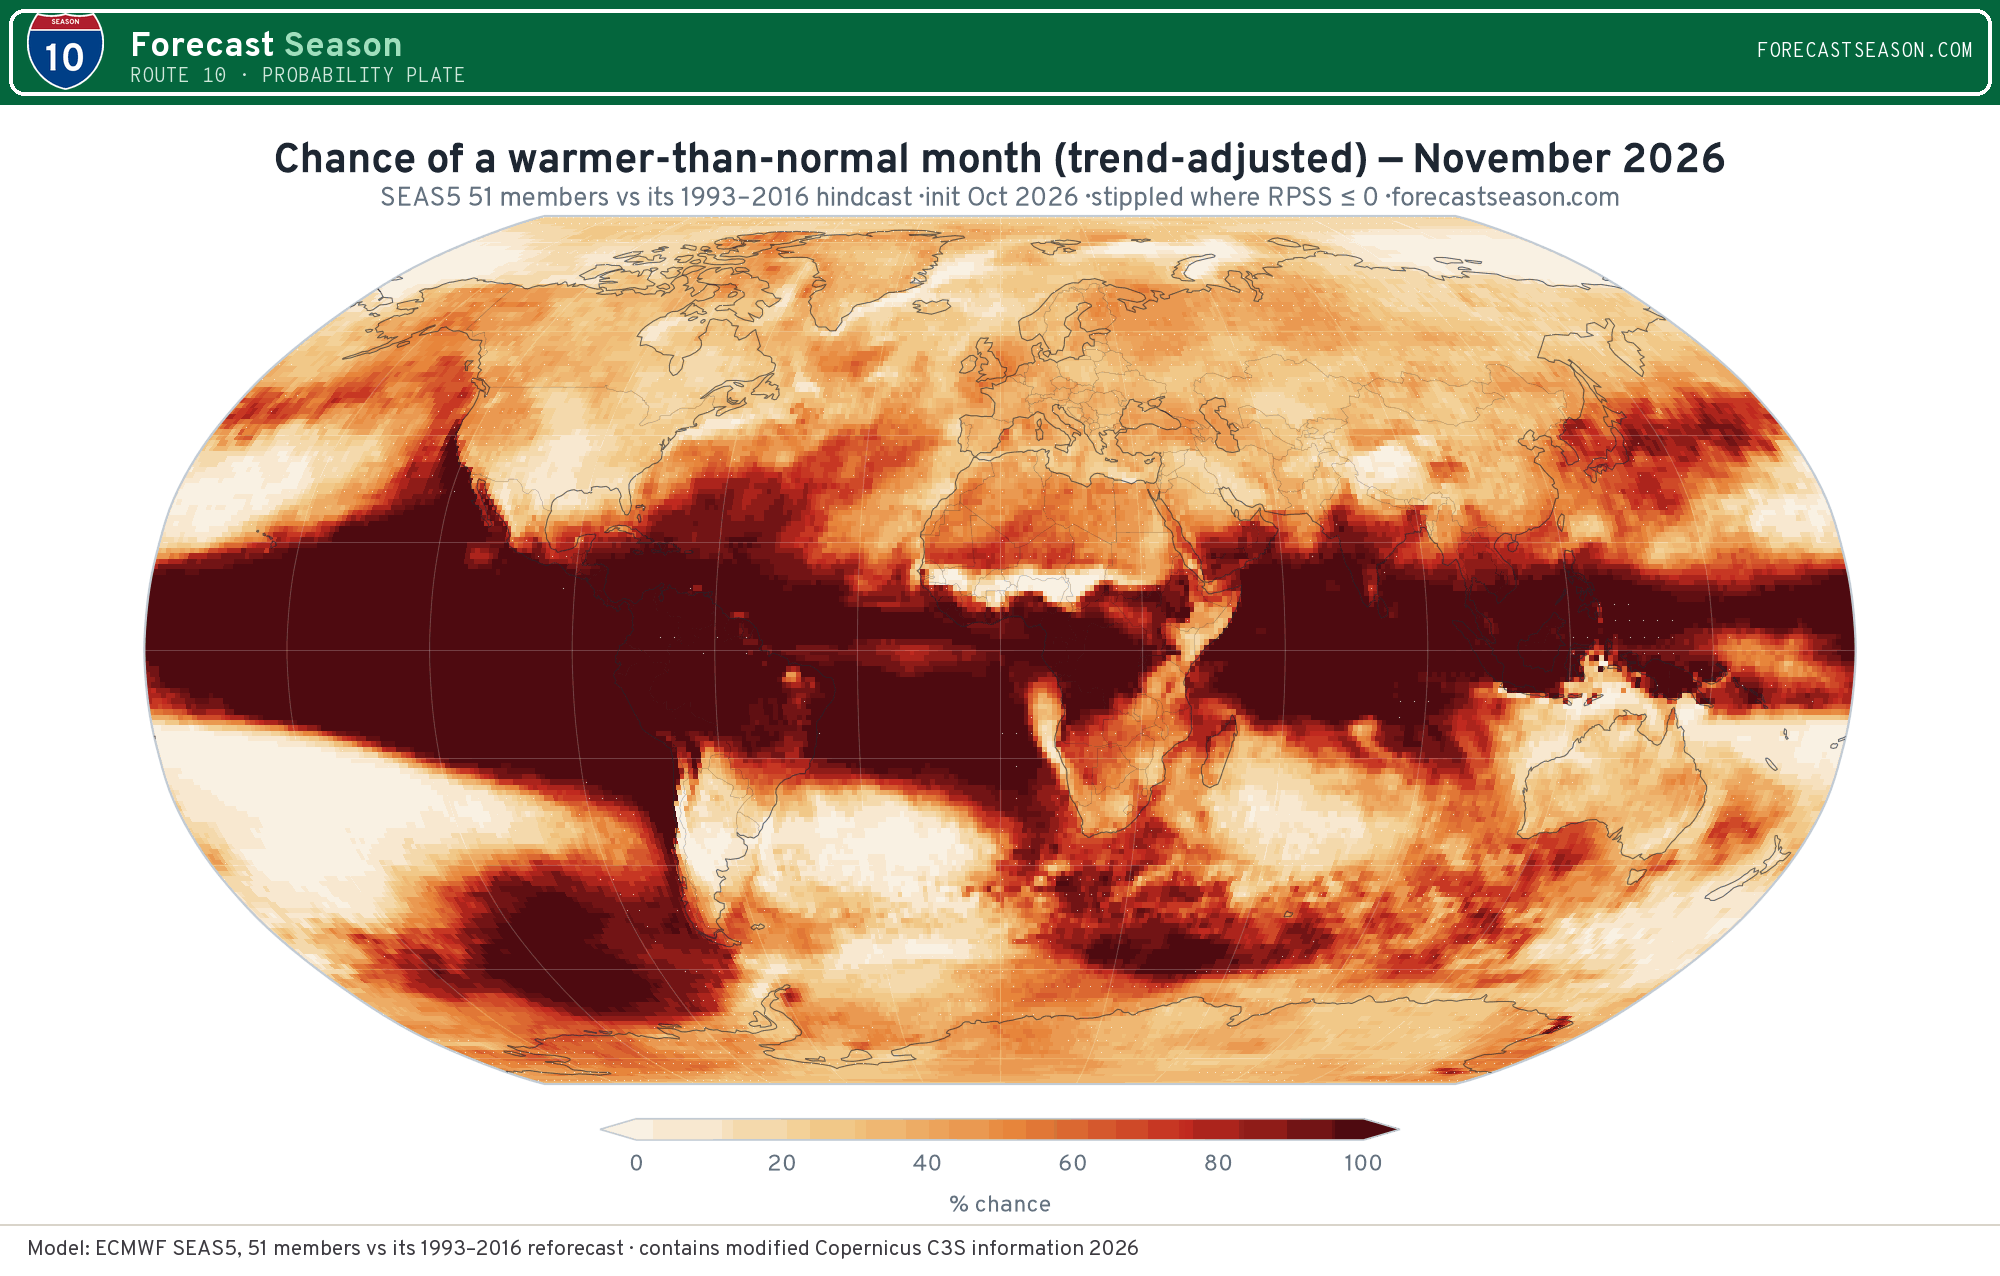
The probability that this month lands in the warmest third of the distribution, with the 1993–2016 tercile boundaries moved to today's climate. Climatology is 33 %. This is the panel to read.
* Lead 1 is the initialisation's own month, so part of it has already happened. It is kept because the model produced it, not because it is a forecast for days that are over.
The rainfall layers are blank over the driest fifth of the land surface. Where the hindcast median is under 5 mm a month, the whole span between "below normal" and "above normal" is about 1.4 mm — not a category, and a model that correctly predicts almost no rain every year scores as highly skilful there for the wrong reason.
What the baseline costs you
raw vs trend-adjusted tercilesThe hindcast runs 1993–2016, so its tercile boundaries describe the climate of around 2005. Scored against those, SEAS5 puts 70–74 % on "warmer than normal" over the whole globe at every lead — true, and nearly information-free, because most of it is the warming since then rather than anything about next month. Moving the same boundaries to today's climate gives a forecast that varies by month and region, which is what a forecast is for.
Temperature
| Month | Raw terciles | Trend-adjusted | Shift |
|---|---|---|---|
| October 2026 | 74% | 58% | -16 |
| November 2026 | 74% | 60% | -14 |
| December 2026 | 74% | 62% | -12 |
| January 2027 | 74% | 64% | -11 |
| February 2027 | 74% | 64% | -10 |
| March 2027 | 74% | 63% | -10 |
Rainfall
| Month | Raw terciles | Trend-adjusted | Shift |
|---|---|---|---|
| October 2026 | 37% | 38% | +1 |
| November 2026 | 36% | 36% | +0 |
| December 2026 | 36% | 36% | +0 |
| January 2027 | 36% | 36% | +0 |
| February 2027 | 36% | 37% | +0 |
| March 2027 | 36% | 37% | +1 |
Rainfall gets one tercile layer rather than two on purpose. The same adjustment moves it by under two points at every lead — the hindcast carries no meaningful rainfall trend to correct for — so a second rainfall panel would look like a product and contain nothing.
The scoreboard
1993–2016 reforecast vs ERA5 · n=24RPSS grades the probabilities themselves against a flat one-in-three forecast: positive means the terciles beat climatology, negative means issuing them is worse than admitting you do not know. ACC grades the ensemble-mean pattern, and is given twice — as it stands, and detrended. Only the detrended column may be set beside the analog engine; the raw one flatters SEAS5 by exactly the amount the world has warmed since 2005.
Temperature
| Month | ACC raw | ACC detrended | RPSS | Area beating climatology |
|---|---|---|---|---|
| October 2026 | 0.76 0.66 | 0.74 0.63 | +0.374 +0.248 | 96% 91% |
| November 2026 | 0.49 0.34 | 0.44 0.26 | +0.164 +0.056 | 77% 61% |
| December 2026 | 0.46 0.31 | 0.43 0.28 | +0.151 +0.042 | 76% 60% |
| January 2027 | 0.42 0.25 | 0.39 0.22 | +0.129 +0.032 | 70% 51% |
| February 2027 | 0.41 0.33 | 0.38 0.29 | +0.109 +0.074 | 69% 64% |
| March 2027 | 0.41 0.33 | 0.36 0.25 | +0.096 +0.064 | 67% 61% |
Rainfall
| Month | ACC raw | ACC detrended | RPSS | Area beating climatology |
|---|---|---|---|---|
| October 2026 | 0.48 0.48 | 0.49 0.49 | +0.143 +0.148 | 75% 67% |
| November 2026 | 0.21 0.16 | 0.22 0.18 | +0.018 +0.004 | 47% 39% |
| December 2026 | 0.21 0.16 | 0.22 0.18 | +0.023 +0.006 | 49% 39% |
| January 2027 | 0.18 0.10 | 0.20 0.12 | +0.014 -0.014 | 45% 31% |
| February 2027 | 0.17 0.12 | 0.17 0.13 | +0.003 -0.007 | 43% 34% |
| March 2027 | 0.14 0.12 | 0.14 0.11 | -0.008 -0.017 | 39% 33% |
Twenty-four years is not many. A pointwise correlation needs |r| > 0.34 to clear 95 % one-sided at this sample size, and the RPSS maps are correspondingly noisy — read them as a coarse mask, not a precision instrument.
How to read this
Four things it is notTerciles
33 % is the null, not zero
A tercile probability of 40 % is not a weak signal — it is a 20 % relative increase over the one-in-three you would say knowing nothing. And 55 % is not "probably": it still leaves nearly half the ensemble in the other two categories. Seasonal forecasting deals in tilts, and a tilt is worth acting on long before it looks like a prediction.
Baseline
Both panels are true
The raw and adjusted maps are the same forecast measured against different questions. Raw asks is this month warm by 1993–2016 standards, and the answer is almost always yes. Adjusted asks is this month warm for the climate we now have, which is the one worth a decision. Neither is a correction of the other.
Rainfall
Mostly not worth issuing
The rainfall RPSS is at or below zero over most land at every lead, meaning a flat one-in-three forecast would do as well or better. The maps are published because that is worth seeing and rarely shown — not because they should be acted on. Where the skill layer is brown, the probability map above it is decoration, and where the land is blank the question itself does not survive contact with a desert.
Members
Fifty-one is not the world
The ensemble samples the uncertainty SEAS5 knows how to represent — initial conditions and its own stochastic physics. It cannot sample the errors it shares with itself: a systematic bias in the way it couples ocean to atmosphere appears in all fifty-one members at once, and shows up as confidence rather than as spread. That is what the hindcast is for.