The Analog Bench
Every other route on this site renders somebody else's model. This one makes a forecast of its own, out of the only thing that has ever actually verified: what happened the last time the ocean looked like this. Eighty-six years of candidates, and a scoreboard that says where it works.
Library
Ocean state
Skill
Frames
Where the ocean is now
observed, not forecastThe predictor is the observed sea-surface temperature pattern over the last three complete months — the ocean is the season's memory, because the atmosphere forgets in a fortnight and the upper ocean does not.
| Observed Niño-3.4, monthly, vs 1991–2020 — 2025-09 to 2026-09 | |||||||||||||
|---|---|---|---|---|---|---|---|---|---|---|---|---|---|
|
The closest years
ranked by pattern correlation · July–August–September 2026Ranked by how closely each year's global sea-surface anomaly pattern resembles this one, after removing the warming trend from both — without that step the nearest analog to any recent year is simply another recent year, which is a true statement about the trend and a useless one about the season.
| Year | Pattern correlation | Its Niño-3.4 | Similarity |
|---|---|---|---|
| 1997 | +0.66 | +1.83 | |
| 2015 | +0.59 | +1.69 | |
| 1972 | +0.56 | +0.92 | |
| 1982 | +0.55 | +0.63 | |
| 1965 | +0.55 | +0.68 | |
| 1957 | +0.50 | +0.54 | |
| 2023 | +0.47 | +1.12 | |
| 1951 | +0.44 | +0.57 | |
| 1953 | +0.44 | +0.33 | |
| 1987 | +0.43 | +1.33 | |
| 1941 | +0.36 | +0.81 | |
| 1983 | +0.35 | -0.18 |
The forecast
5 layers · 7 views · 5 seasons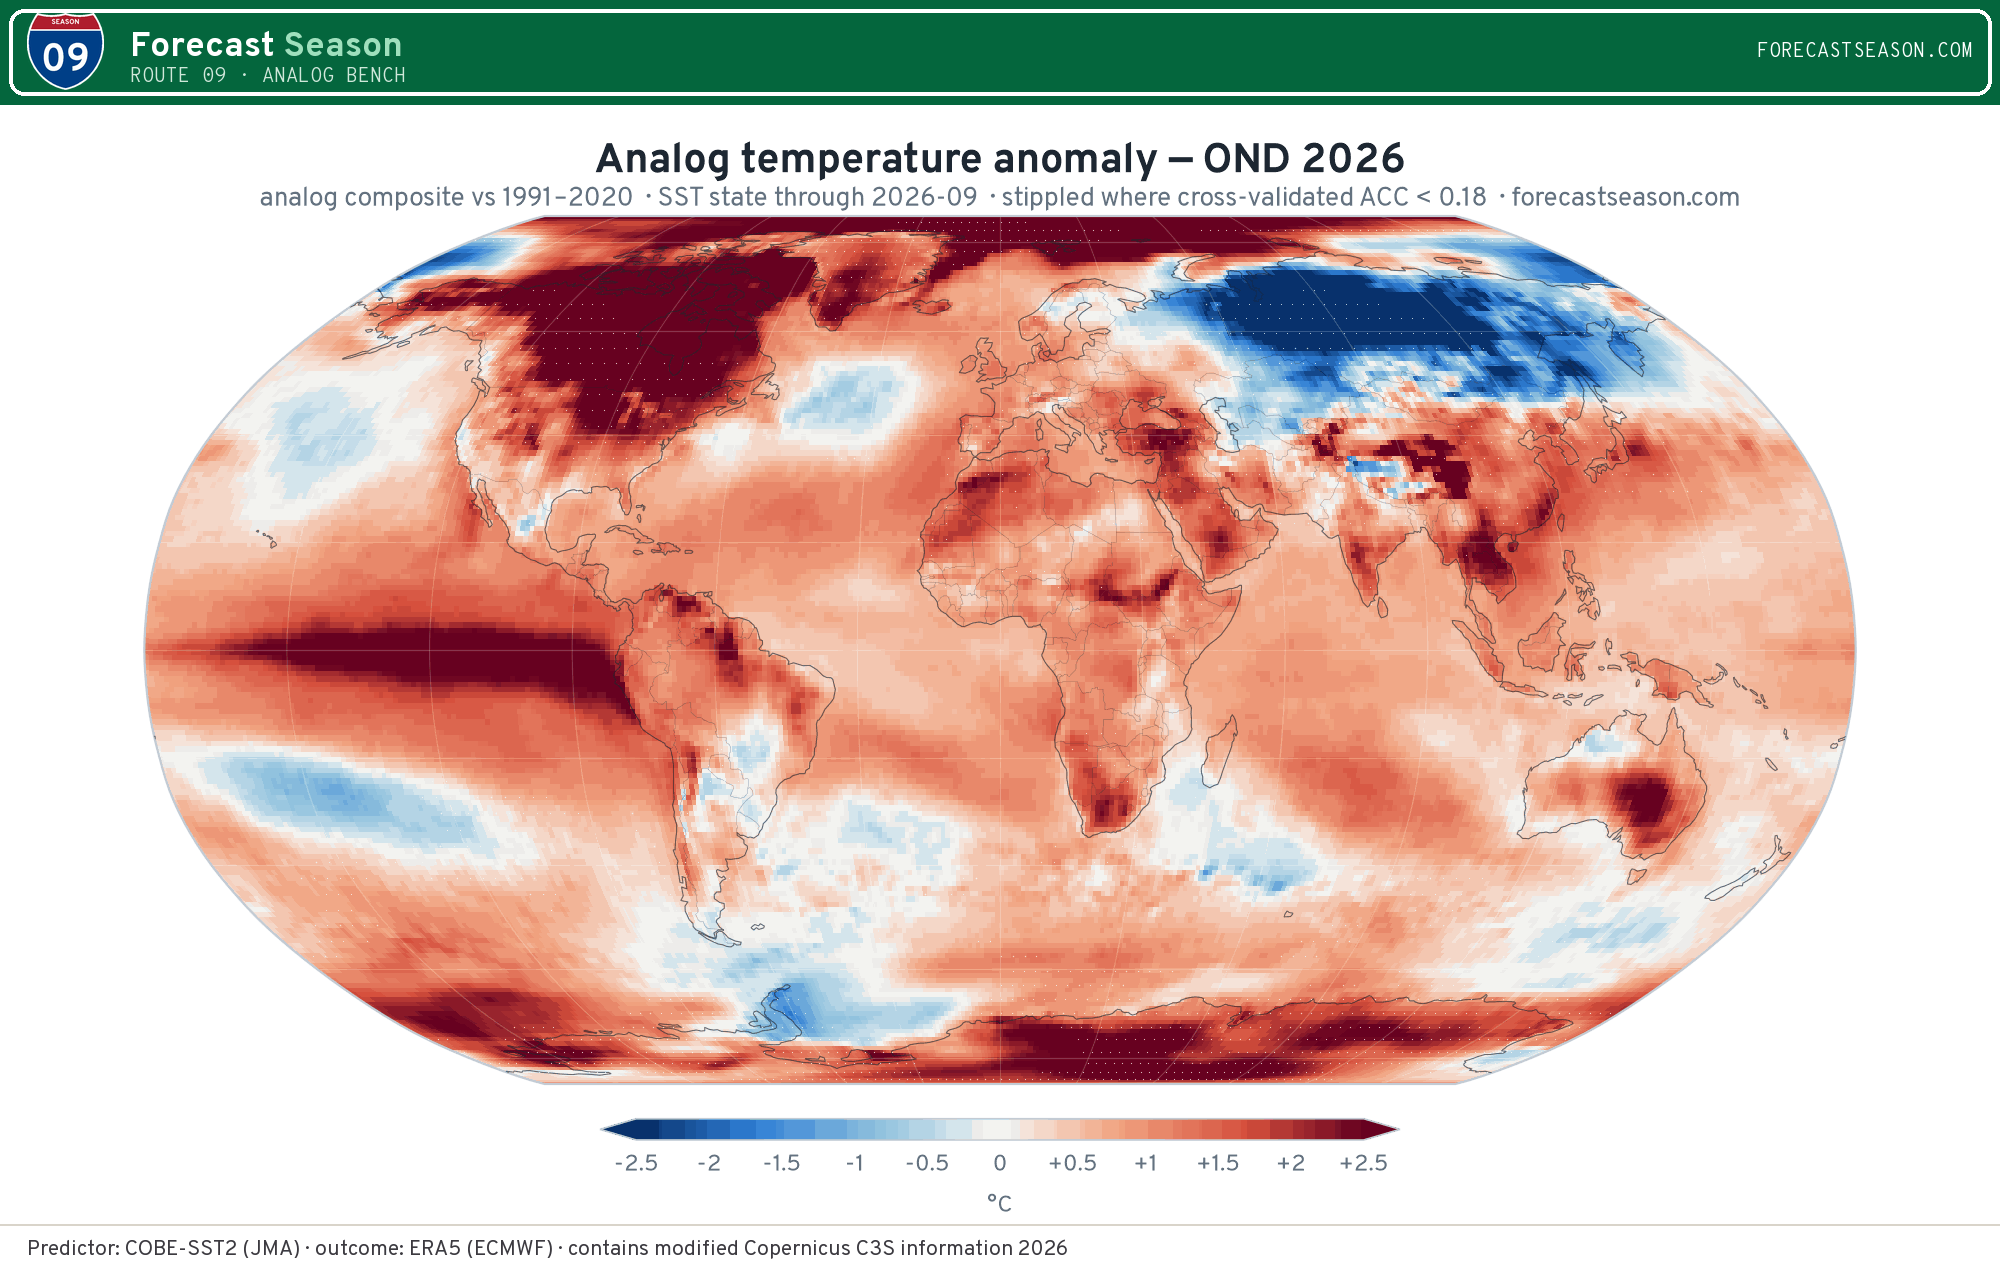
The constructed-analog composite: what the seasons that followed the closest historical sea-surface states actually did, projected onto this year. Stippled where the method cannot beat chance.
The scoreboard
leave-one-out, 1940–2025For every year in the record the engine was rebuilt with that year withheld and asked to forecast it. The numbers are anomaly correlation, global first and land second, with the trend removed from both sides — so this is skill at the season, not credit for knowing that the world has warmed since 1940.
Temperature
| Season | Constructed | Top-10 by correlation | Top-10 by RMSD |
|---|---|---|---|
| OND 2026 | 0.429 0.263 land | 0.268 0.139 | 0.298 0.153 |
| NDJ 2027 | 0.384 0.207 land | 0.257 0.119 | 0.271 0.128 |
| DJF 2027 | 0.359 0.194 land | 0.247 0.109 | 0.260 0.129 |
| JFM 2027 | 0.339 0.193 land | 0.245 0.133 | 0.255 0.150 |
| FMA 2027 | 0.334 0.213 land | 0.246 0.164 | 0.252 0.172 |
Rainfall
| Season | Constructed | Top-10 by correlation | Top-10 by RMSD |
|---|---|---|---|
| OND 2026 | 0.194 0.159 land | 0.116 0.090 | 0.086 0.045 |
| NDJ 2027 | 0.174 0.139 land | 0.090 0.047 | 0.068 0.028 |
| DJF 2027 | 0.165 0.120 land | 0.076 0.007 | 0.055 -0.001 |
| JFM 2027 | 0.148 0.106 land | 0.075 0.015 | 0.053 0.010 |
| FMA 2027 | 0.143 0.127 land | 0.072 0.029 | 0.045 0.007 |
Anything below 0.18 is not significantly different from chance at 95 % with this many years, and is stippled out on the world maps above.
How to read this
Four things it is notMethod
The best forecast names no years
The year list and the map are made by different methods, and the scoreboard says so. The named years are the twelve closest patterns — the part worth reading, because you can go and look them up. The map is a constructed analog: a signed least-squares combination of all eighty-six years at once, which scores roughly twice as well and names nobody. Showing only the first would be friendlier; showing only the second would be honest but unreadable.
Trend
Two maps, and the gap between them
The anomaly layer is measured against 1991–2020 and includes the warming trend; the signal layer has that trend taken back out. The difference between them is not a rounding error — over most of the world the trend is the larger half of the anomaly, and a seasonal map that quietly folds the two together is mostly reporting the climate, not the season.
Rainfall
Mostly, we cannot
Seasonal rainfall analog skill is low almost everywhere outside the tropics, and the scoreboard shows it: a fifth of the temperature figure, and below significance over most land. The rainfall maps are published because that is worth seeing, not because they are actionable. Read the skill layer first.
Analogs
No two seasons are the same
A pattern correlation of +0.48 is a good analog by the standards of this record and still leaves three-quarters of the variance unexplained. The ocean repeats itself loosely, the atmosphere over it does not repeat at all, and the ice, the land and the stratosphere are all in different places than they were in 1982. An analog is an argument, not a precedent.