The Copernicus Multi-System
Every outlook you read comes from one centre, and almost none of them tell you whether the others agree. This puts ten systems from nine centres on one grid and one calendar, each calibrated against its own reforecast, and shows both what they say together and how far apart they are. Then it does the part that matters: it checks whether the consensus is actually better than the best single model, and publishes the answer either way.
Systems
Members
Consensus vs ECMWF
Agreement
The plate
9 layers · 7 views · 6 months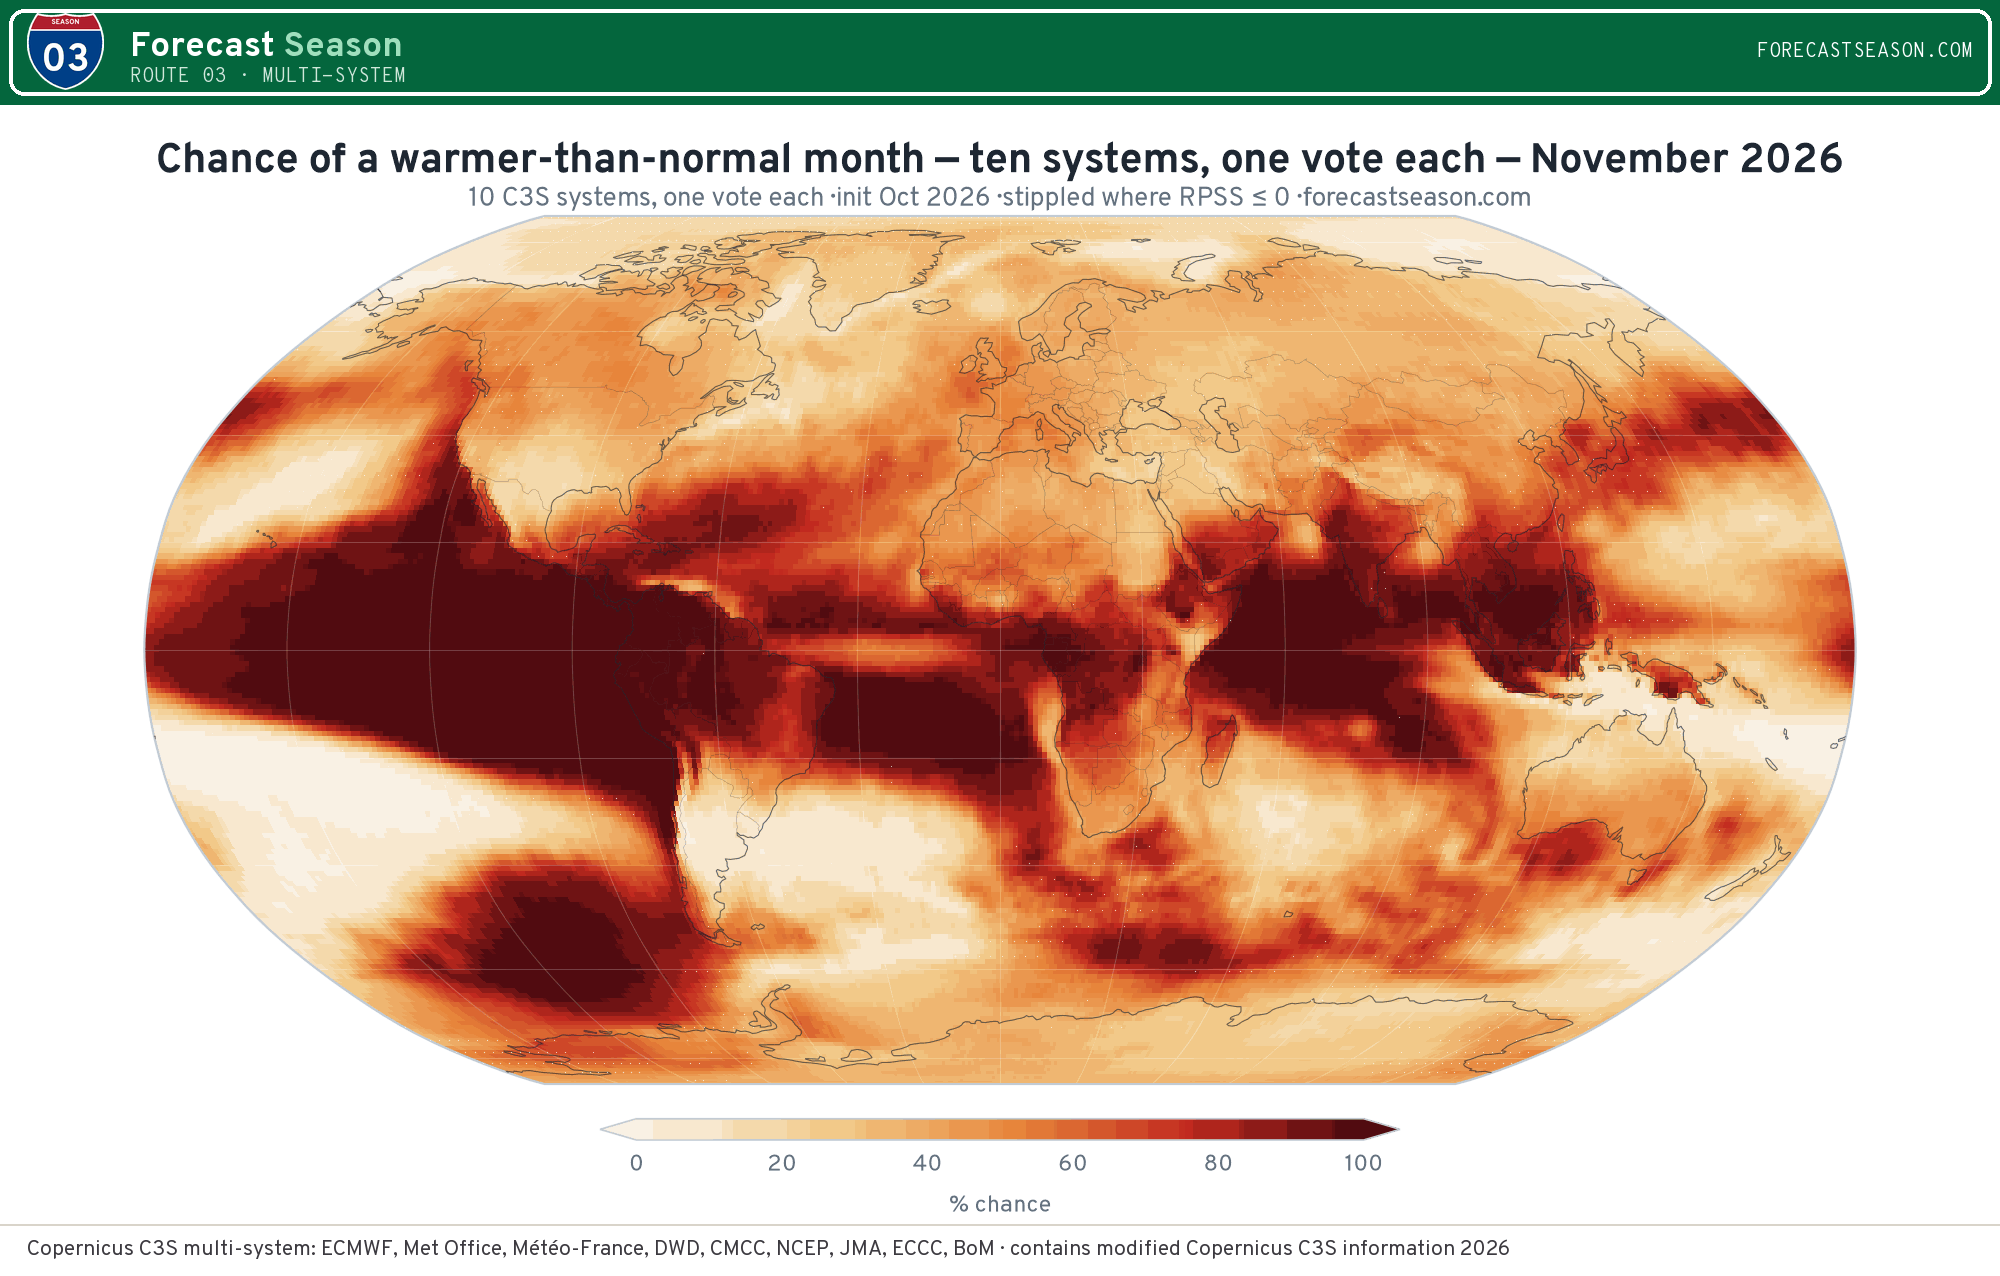
Each centre's probability computed inside its own ensemble against its own hindcast, then averaged. Climatology is 33 %. Tercile boundaries are moved to today's climate, for the reason route 10 sets out at length.
* Lead 1 is the initialisation's own month, so part of it has already happened. It is kept because the models produced it, not because it is a forecast for days that are over.
Every panel except the skill layers is stippled where the multi-system RPSS is zero or below — where issuing these probabilities would be no better than saying nothing. That includes the agreement layer, deliberately: ten models concurring in a place none of them can forecast is exactly the picture this site should not publish unmarked.
Agreement is not skill
the warning this route exists to giveA map showing ten models in agreement is the most persuasive thing this site could publish, and one of the easiest ways it could mislead you. These systems are not independent witnesses. They share ancestry, they share resolution limits, several share components outright, and they share the same well-known biases in how the tropical ocean drives the atmosphere. When they agree, they may simply be agreeing on an error — and a consensus of ten wrong answers looks exactly like a consensus of ten right ones.
That is why the agreement layer is stippled on skill rather than left clean, why the scoreboard below is on the same page rather than a link away, and why the panel worth reading first is not the consensus but the gain — what the other nine centres actually add to ECMWF alone, measured, and drawn whichever way it comes out.
Temperature
| Month | Chance above normal | Systems agreeing | Land unanimous | Spread (pts) |
|---|---|---|---|---|
| October 2026 | 56% 53% | 7.1 /10 | 21% | 18 |
| November 2026 | 56% 54% | 7.4 /10 | 25% | 13 |
| December 2026 | 58% 56% | 7.7 /10 | 34% | 12 |
| January 2027 | 59% 60% | 8.2 /10 | 39% | 12 |
| February 2027 | 59% 62% | 8.7 /10 | 44% | 11 |
| March 2027 | 59% 61% | 8.4 /10 | 42% | 12 |
Rainfall
| Month | Chance above normal | Systems agreeing | Land unanimous | Spread (pts) |
|---|---|---|---|---|
| October 2026 | 37% 38% | 6.8 /10 | 10% | 16 |
| November 2026 | 37% 38% | 7.2 /10 | 11% | 12 |
| December 2026 | 36% 37% | 7.0 /10 | 11% | 12 |
| January 2027 | 36% 36% | 7.1 /10 | 12% | 11 |
| February 2027 | 36% 36% | 7.0 /10 | 10% | 12 |
| March 2027 | 36% 37% | 6.8 /10 | 6% | 12 |
"Systems agreeing" counts how many put their highest probability on the same tercile as the published consensus, averaged over land. The floor is not zero but roughly 3 — with three categories and no signal at all, a third of the systems land on the same one by chance.
The scoreboard
1993–2016 reforecasts vs ERA5 · n=24Every system scored inside one leave-one-out, over land, on identical footing: for each held-out year each system's tercile boundaries are rebuilt from its own other 23 reforecast years before the ten are averaged. Calibrating once on all 24 and holding out only at the averaging step would score each model partly against its own answer, and the consensus would inherit ten times that flattery rather than escape it. The best single system in each row is marked; the last two columns say by how much the consensus beat it and how many systems beat the consensus.
Temperature
| Month | bom-2 | cmcc-4 | dwd-22 | eccc-4 | eccc-5 | ecmwf-51 | jma-4 | meteo_france-9 | ncep-2 | ukmo-610 | Consensus | vs best | Beat it |
|---|---|---|---|---|---|---|---|---|---|---|---|---|---|
| October 2026 | +0.185 | +0.123 | -0.072 | +0.131 | +0.208 | +0.248 | +0.113 | +0.177 | +0.104 | +0.198 | +0.268 | +0.021 | 0 |
| November 2026 | +0.035 | +0.014 | -0.029 | +0.014 | +0.038 | +0.056 | -0.015 | +0.063 | +0.002 | +0.048 | +0.094 | +0.032 | 0 |
| December 2026 | +0.028 | +0.015 | -0.027 | -0.000 | +0.036 | +0.042 | -0.051 | +0.030 | +0.006 | +0.041 | +0.076 | +0.034 | 0 |
| January 2027 | +0.028 | +0.018 | -0.006 | +0.018 | +0.043 | +0.032 | -0.010 | +0.042 | +0.013 | +0.046 | +0.082 | +0.035 | 0 |
| February 2027 | +0.075 | +0.063 | +0.011 | +0.049 | +0.082 | +0.074 | +0.024 | +0.092 | +0.026 | +0.091 | +0.117 | +0.025 | 0 |
| March 2027 | +0.062 | +0.048 | +0.015 | +0.031 | +0.048 | +0.064 | +0.008 | +0.085 | +0.005 | +0.071 | +0.102 | +0.017 | 0 |
Rainfall
| Month | bom-2 | cmcc-4 | dwd-22 | eccc-4 | eccc-5 | ecmwf-51 | jma-4 | meteo_france-9 | ncep-2 | ukmo-610 | Consensus | vs best | Beat it |
|---|---|---|---|---|---|---|---|---|---|---|---|---|---|
| October 2026 | +0.091 | +0.048 | -0.099 | +0.019 | +0.078 | +0.147 | +0.015 | +0.061 | +0.024 | +0.092 | +0.154 | +0.007 | 0 |
| November 2026 | -0.008 | -0.002 | -0.029 | -0.020 | -0.025 | +0.004 | -0.062 | +0.011 | -0.014 | +0.006 | +0.042 | +0.030 | 0 |
| December 2026 | -0.001 | +0.003 | -0.033 | -0.021 | -0.015 | +0.006 | -0.057 | +0.000 | -0.036 | +0.015 | +0.039 | +0.025 | 0 |
| January 2027 | -0.014 | -0.022 | -0.017 | -0.032 | -0.016 | -0.013 | -0.066 | -0.011 | -0.027 | -0.012 | +0.029 | +0.040 | 0 |
| February 2027 | -0.026 | -0.022 | -0.015 | -0.040 | -0.010 | -0.007 | -0.066 | -0.010 | -0.046 | -0.011 | +0.025 | +0.032 | 0 |
| March 2027 | -0.030 | -0.033 | -0.032 | -0.055 | -0.033 | -0.018 | -0.095 | -0.018 | -0.044 | -0.023 | +0.012 | +0.030 | 0 |
The rainfall result is the strongest case this route makes. Taken one at a time, seasonal rainfall terciles are close to worthless: at every full lead between 6 and 10 of the 10 systems score negative RPSS over land — issuing their probabilities is worse than admitting you do not know — and in January 2027 that is 10 of 10, with ecmwf-51 itself at -0.0132. Averaged, the same ten systems are positive at 5 of 5 leads. Route 10 concluded that one model's rainfall terciles were mostly not worth issuing, and that stands. This is the amendment: as a consensus they cross into being worth issuing, barely — which is a smaller claim than it sounds and a larger one than nothing.
Twenty-four years is not many, and a per-system RPSS from 24 cases is noisy — the ranking between two close systems is not meaningful, though the gap between the consensus and the field usually is. The benchmark column uses ecmwf-51, the system route 10 publishes on its own.
Who is in
10 systems · 682 membersMembership is not a fixed club. CDS is asked which systems carry each initialisation month and the answer changes through the year — the Met Office moved from system 604 to 605 to 610 across 2026, and JMA has no system at all for some months. What follows is who was actually in this run.
| Centre | System | CDS id | Members | Reforecast members |
|---|---|---|---|---|
| Bureau of Meteorology | ACCESS-S2 | bom-2 | 110 | 27 |
| CMCC | SPSv4 | cmcc-4 | 50 | 30 |
| DWD | GCFS2.1 | dwd-22 | 50 | 30 |
| Environment and Climate Change Canada | CanESM5.1 / GEM5.2-NEMO | eccc-4 | 20 | 20 |
| Environment and Climate Change Canada | CanESM5.1 / GEM5.2-NEMO | eccc-5 | 20 | 20 |
| ECMWF | SEAS5.1 | ecmwf-51 | 51 | 25 |
| JMA | CPS3/CPS4 | jma-4 | 150 | 10 regridded from 145×288 |
| Météo-France | System 9 | meteo_france-9 | 51 | 31 |
| NCEP | CFSv2 | ncep-2 | 120 | 24 |
| Met Office | GloSea6 | ukmo-610 | 60 | 28 |
Member counts range from 20 to 155, which is why each system gets one vote rather than one vote per member: pooling members would let the largest ensembles outvote the rest and produce a map mostly of who runs the most members. Note also that a system's reforecast is usually much smaller than its live ensemble — the probabilities are as fine-grained as the live members allow, but the skill estimate is only as good as the reforecast behind it.
How to read this
Four things it is notConsensus
Not a better model
Averaging systems cancels the errors they do not share and keeps the ones they do. That is usually worth a little skill, and occasionally worth none at all. Route 11 found the same thing blending two engines: when one source is clearly better, averaging it with a weaker one throws skill away. The scoreboard is on this page so you can check rather than assume.
Independence
Ten opinions, fewer minds
Several of these systems share an ocean model, a land surface, or a convection scheme. Two of them come from the same centre. Treating the count of agreeing systems as a sample size — as though nine of ten were nine independent confirmations — overstates the evidence, sometimes by a lot.
One grid
Nearly true
Nine of the ten arrive on the common one-degree mesh. JMA arrives on its native 1.25° grid and is interpolated onto the others. That interpolation adds no information — JMA's forecast still holds only what its own grid holds — and it is named in the roster rather than hidden in a method note.
Calibration
Each against itself
Every system's probabilities come from its own reforecast, never from a shared climatology. A coupled model's drift is its own, and the boundaries that make its members mean anything are the boundaries of its own past runs. This is also what makes the ten comparable at all: they are each answering the same question about themselves.